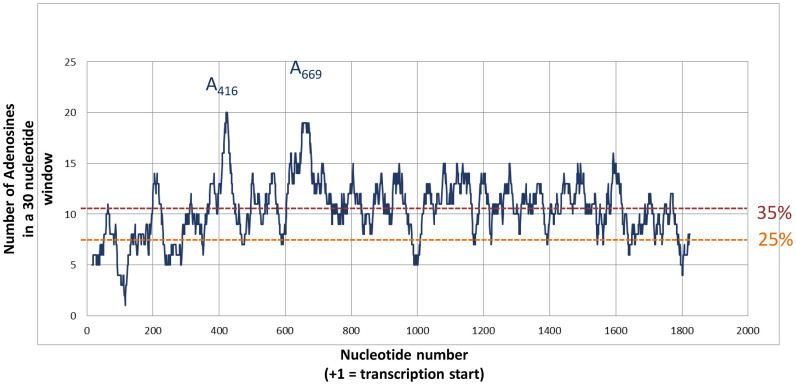
Figure 6.
Adenosine distribution in HIV-1 Gag open reading frame. For each nucleotide within the 5’ UTR and the whole Gag ORF of the PNL4.3, the number of Adenosine within the 20 surrounding positions (9 in 5΄ and 10 in 3΄) was plotted. Two dotted lines indicate the level of 25% adenosine (as expected in a random distribution) and 35% (as the mean observed in Gag ORF).The nucleotides corresponding to the two major peaks (A416 and A669) are indicated.

