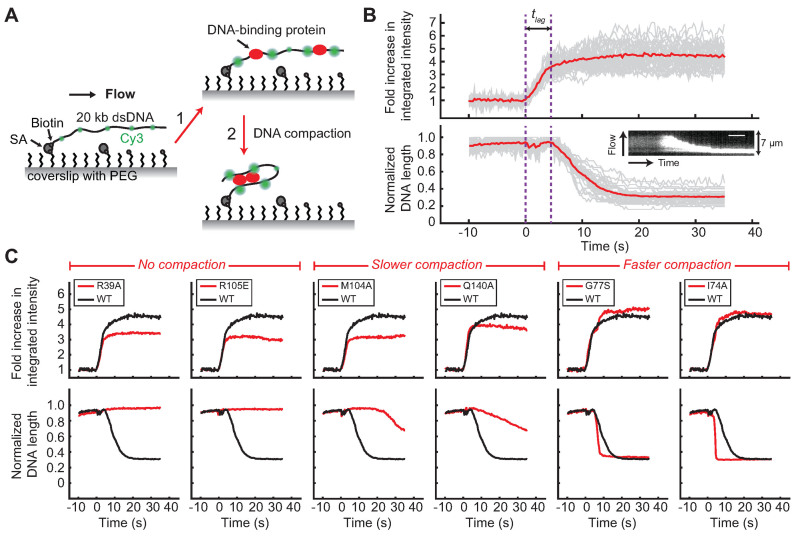
Figure 3.
Single-molecule DNA compaction by BsSpo0J (see colors online). (A) Schematic of the single-molecule protein-induced fluorescence enhancement (PIFE) assay (35). A 20-kb dsDNA sparsely labeled with Cy3 dyes (green) is tethered to the surface of a functionalized glass coverslip and extended by buffer flow. Step 1: binding of unlabeled proteins to DNA enhances the fluorescence of nearby Cy3 dyes (red) due to PIFE. Step 2: changes in DNA conformation mediated by proteins can be simultaneously detected as a change in length of flow-stretched DNAs. PEG, polyethylene glycol; SA, streptavidin. Figures are not drawn to scale. (B) Demonstration of the single-molecule PIFE assay with wild-type BsSpo0J (100 nM). Trajectories of individual DNAs are shown in gray and the average over all trajectories (n = 38) is shown in red. The fold increase in integrated fluorescence intensity over time was calculated by dividing each trajectory by the value averaged for the first 5–10 s before protein binding. DNA length was normalized to the maximum values in individual trajectories. Time zero was defined as the starting point of protein association. tlag is lag time between protein binding and the initiation of DNA compaction. Insert: kymograph of a single DNA. Scale bar = 6 s. (C) Fold increase in the integrated fluorescence intensity and DNA length trajectories for wild-type BsSpo0J (black; the same curve is reproduced in each panel) and mutants (red) at a protein concentration of 100 nM. Each trajectory was averaged over 20–30 Cy3-labeled DNAs. See Supplementary Figures S9 and 12 for trajectories of all characterized mutants.

