Fig. 3.
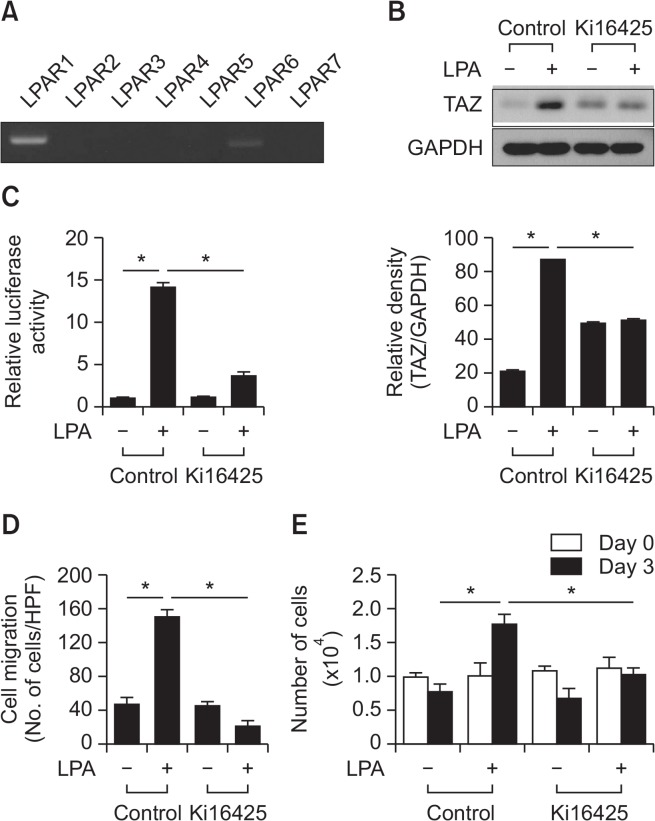
Involvement of LPAR1 in the LPA-induced migration and proliferation of MSCs. (A) The expression level of the LPA receptors was determined using RT-PCR. (B) MSCs were treated with vehicle control or Ki16425 (10 μM), LPAR1 and 3 inhibitor, followed by Western blotting analysis with indicated antibodies (left panel). Quantification of TAZ expression normalized by GAPDH expression is shown (right panel). Data indicate mean ± SD. *p<0.05 (n=4). (C) YAP/TAZ-responsive reporter (8×GTIIC-luciferase) activities in MSCs after treatment of LPA (10 μM) in the presence or absence of 10 μM Ki16425 are shown. Data indicate mean ± SD. *p<0.05 (n=4). (D) The inhibitory effect of Ki16425 (10 μM) on LPA-induced (1 μM) MSC migration is shown. Data indicate mean ± SD. *p<0.05 (n=8). (E) The inhibitory effect of Ki16425 (10 μM) on LPA-induced (10 μM) MSC proliferation is shown. The cell proliferation rate was determined by cell count using a trypan blue inclusion assay. Data indicate mean ± SD. *p<0.05 (n=6).

