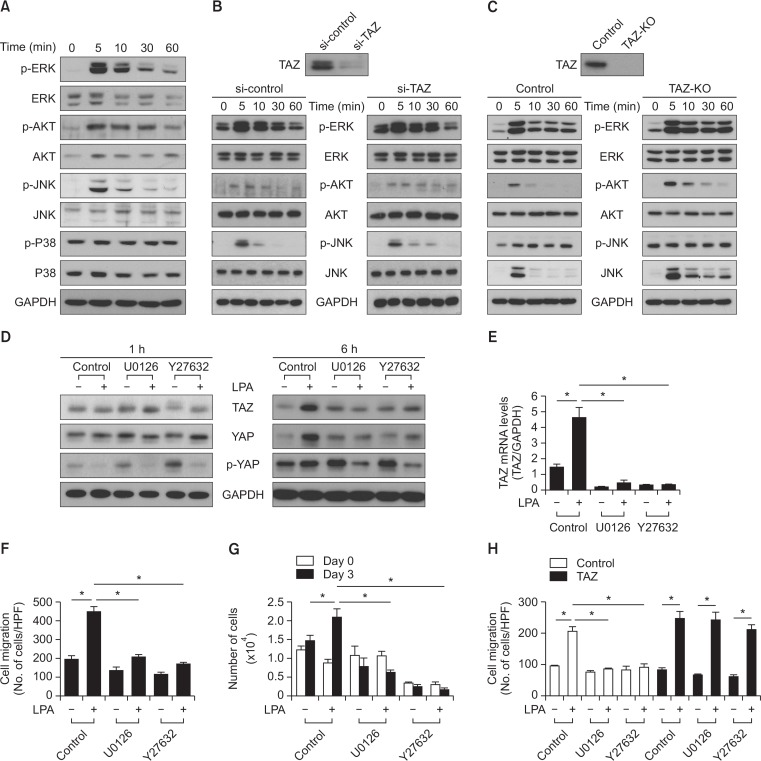
Fig. 4.
Effects of the MEK inhibitor and the ROCK inhibitor on LPA-induced regulation of hippo signaling in MSCs. (A) The LPA stimulated phosphorylation of MAP kinases in MSCs is shown. MSCs were treated with LPA (10 μM) for the indicated times and subjected to Western blotting analysis with indicated antibodies. (B) siRNA-mediated silencing of TAZ expression is shown. LPA-stimulated phosphorylation of MAP kinases in both the control and TAZ knockdown-MSCs. (C) The wild-type MEFs (control) and TAZ-knockout MEFs (TAZ-KO) were treated with LPA (10 μM) for the indicated times and subjected to Western blotting analysis. The expression level of the indicated antibodies and GAPDH were determined using Western blotting. (D) The effect of U0126 and Y-27632 on LPA-induced TAZ, YAP, and p-YAP expressions are shown. MSCs were treated with vehicle control, U0126 (10 μM) or Y-27632 (10 μM), followed by stimulation with LPA (10 μM) for the indicated times. The expression levels of TAZ, YAP, p-YAP, and GAPDH were determined by Western blotting analysis. (E) Real-time PCR analysis revealed the mRNA expression levels of TAZ in MSCs. MSCs were pretreated with U0126 (10 μM) and Y-27632 (10 μM), followed by treatment with LPA (10 μM) for 6 h. (F) The effect of U0126 (10 μM) and Y-27632 (10 μM) on LPA-induced (1 μM) migration of MSCs. Data indicate mean ± SD. *p<0.05 (n=8). (G) The effect of U0126 (10 μM) and Y-27632 (10 μM) on the LPA-induced (10 μM) cellular proliferation of MSCs. The cellular proliferation rate was determined by cell counting using a trypan blue inclusion assay. Data indicate mean ± SD. *p<0.05 (n=6). (H) TAZ overexpression reversed the inhibitory effect of U0126 (10 μM) or Y27632 (10 μM) on LPA-induced (1 μM) MSCs migration. Data indicate mean ± SD. *p<0.05 (n=8).

