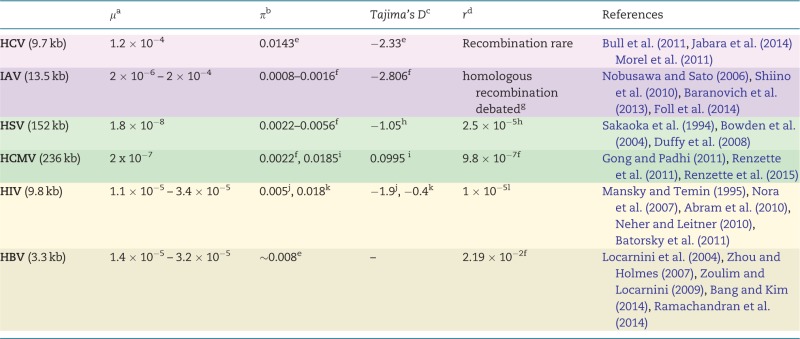
Table 1.
Estimates of population parameters for various viruses
 |
Estimates for several population genetic parameters for the six viruses highlighted here. Shading indicates viral type: purple represents RNA viruses, green represents DNA viruses, and beige represents those that utilize both DNA and RNA. Genome sizes are given under virus names. Most studies were based on clinical samples, but some relied on databases such as GenBank or the Los Alamos HIV database. Estimates of Tajima’s D in Hepatitis B have not been found to be reported. References are listed with respect to the order of entries per row; those within a single pair of brackets represent a single table entry. We emphasize that this table serves as a guide only, and that the original studies should always be consulted for technical details.
aμ, mutation rate: given as nucleotide substitutions/base/replication (genome-wide), from experimental measures.
bπ, nucleotide diversity: between-host estimates either from regions of interest with regards to resistance or from the full-genome.
cTajima’s D, a test-statistic to distinguish neutrally evolving populations from those evolving under non-random process(es); between-host estimates from either specific regions or the full-genome.
dr, recombination rate: given as recombination events/site/generation, based on population-level sequence diversity.
eProtease (0.13 kb, n = 20).
fGenome-wide.
gSee Han and Worobey (2011) for discussion.
hUL (2 kb, n = 42).
iUS28 (2.5 kb, n = 103).
jR(everse)T(ranscriptase) (0.6 kb, n = 28).
kenvelope (1.3 kb, n = 28).
lpol (3 kb, n = 9), effective recombination rate.
