
Figure 2.
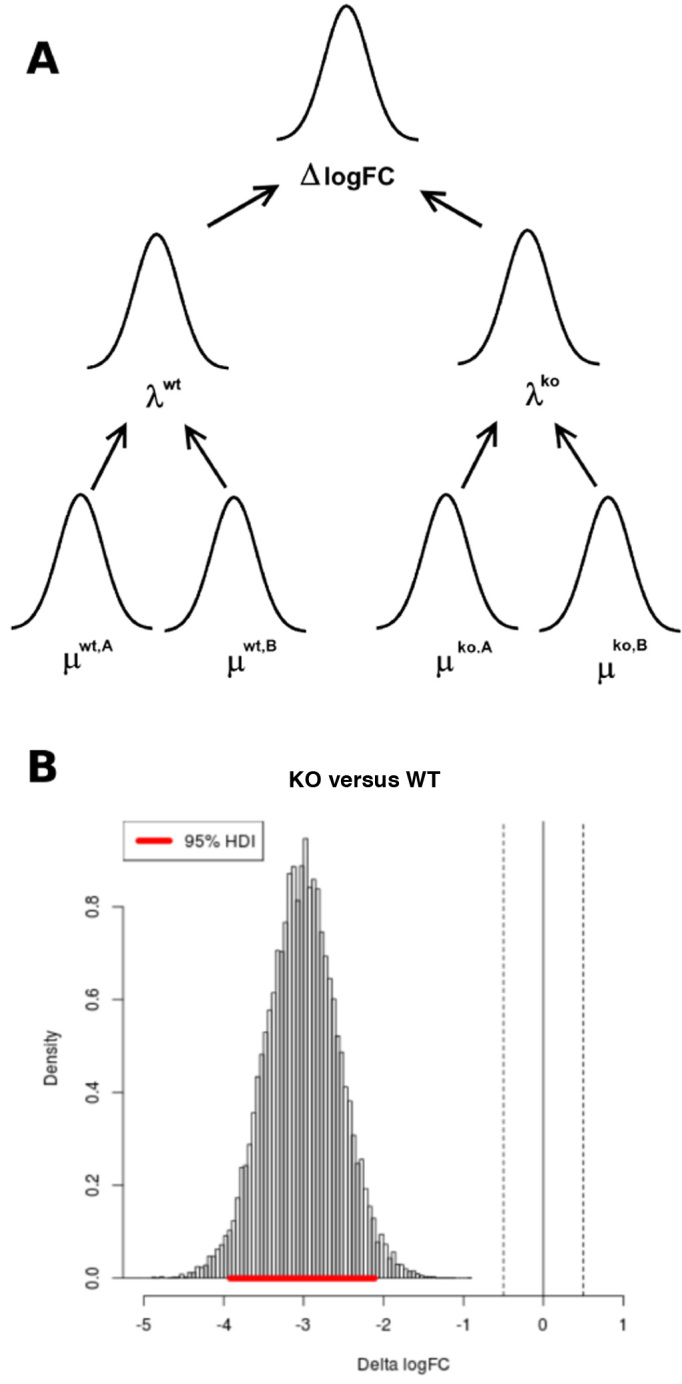
(A) Graphical illustration of Monte Carlo (MC) sampling procedure. Samples from the posterior means (μ) are generated for each strain and condition. A sample of the log-fold-change in means (λ) is then obtained from the sample of means. Finally, the difference in the log-fold-change in means is obtained. (B) Example distribution of Δlog FC. The highest density interval gives the 95% credible region for the Δlog FC, shown in red.