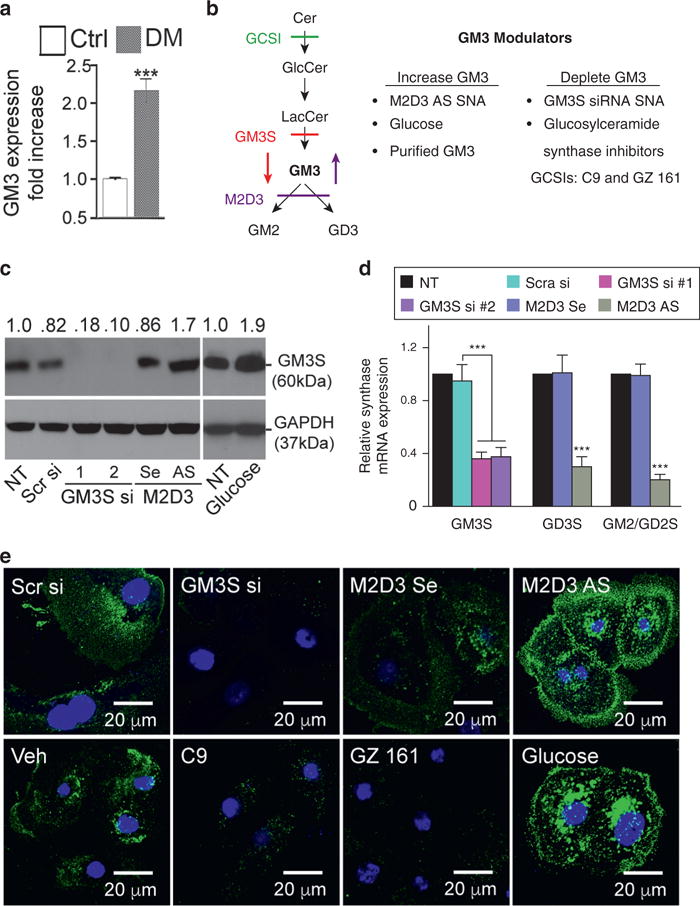
Figure 1. Manipulation of GM3 levels.

(a) GM3 quantification by ELISA from human diabetic (n = 7, DM) and age- and sex-matched normal (n = 5, Ctrl) plantar epidermis. (b) Left: pathways for GM3 synthesis and metabolism. Right: GM3 manipulation effects. (c) After 72 hours, treatment with two different GM3S siRNA SNAs (GM3S si), bispecific M2D3 AS SNA, supplemental glucose, or controls, GM3S protein was detected by immunoblotting with anti-GM3S antibody. (d) After 72 hours treatment with GM3S siRNA or M2D3 AS SNA, GM3S, GD3S, and GM2/GD2S mRNA expression was detected by quantitative real-time reverse transcriptase–PCR. (e) NHEKs were treated with SNAs, supplemental glucose, glucosylceramide synthase inhibitors (GCSIs, GZ 161, and C9), or controls. GM3 expression was detected by confocal microscopy with anti-GM3 antibody. Scale bar = 20 μm. ***P < 0.001. AS, antisense DNA; Cer, ceramides; Ctrl, control; DM, diabetic; GlcCer, glucosylceramide; LacCer, lactosylceramide; NT, no treatment; Scr, scrambled; Se, sense; si, small interfering RNA; SNA, spherical nucleic acid; Veh, vehicle.
