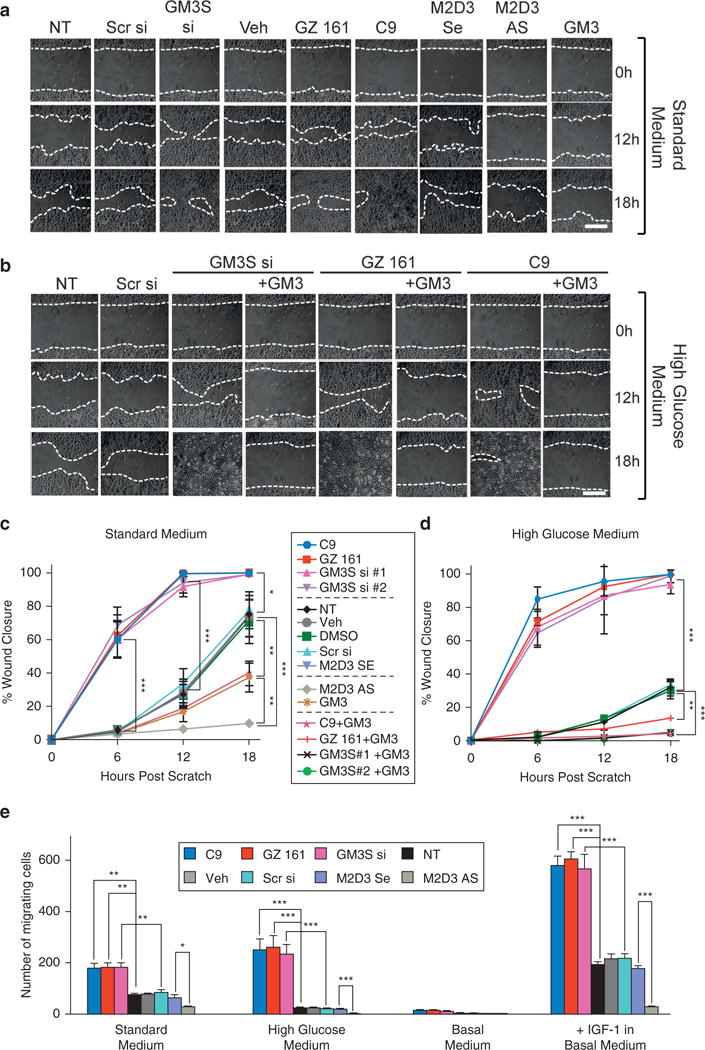
Figure 2. GM3 levels regulate NHEK migration.

Representative scratch assays after GM3 modulation in the presence of (a, c) standard medium and (b, d) medium supplemented with 12 mmol/L glucose (total = 18 mmol/L). (a, b) Dotted lines highlight the wound edge. Graphs showing wound closure in (c) standard medium and (d) high glucose; the central key identifies lines in both graphs. (e) Boyden chemotaxis assay. Treated NHEKs were grown in standard complete (left) or high glucose (right) medium or were starved overnight (basal medium) and stimulated with IGF1 (100 ng/ml) for 18 hours of migration. *P < 0.05, **P < 0.01, ***P < 0.001. Scale bar in a and b = 500 μm. AS, antisense DNA; h, hours; NHEK, normal human epidermal keratinocyte; NT, no treatment; Scr, scrambled; SE, sense; si, small interfering RNA; Veh, vehicle.
