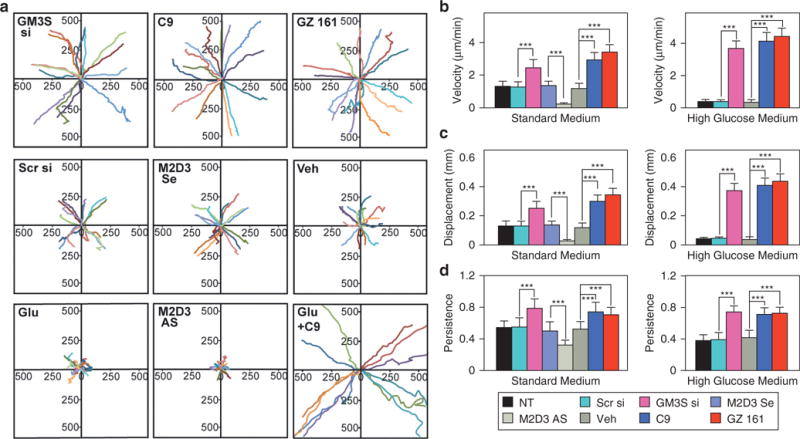
Figure 3. GM3 depletion increases NHEK velocity and directional migration.

Single-cell movement was monitored in 4-minute intervals for 100–140 minutes using live cell imaging and computerized analysis. (a) Vector maps (rose diagrams) of IGF-1 stimulated cell migration from start (0) to end as distance in μm. shown are 15 representative cells of the total 60–100 NHEKs analyzed per condition. (b) Velocity, (c) net displacement, and (d) persistence coefficient (also called processivity; net displacement/total distance with 1 representing a linear path) of modulated NHEKs in standard complete (left) and high glucose (right) medium. Mean ± standard deviation. ***P< 0.001. AS, antisense DNA; Glu, glucose; IGF-1, insulin-like growth factor-1; min, minutes; NHEK, normal human epidermal keratinocyte; NT, no treatment; Scr, scrambled; Se, sense; si, small interfering RNA; Veh, vehicle.
