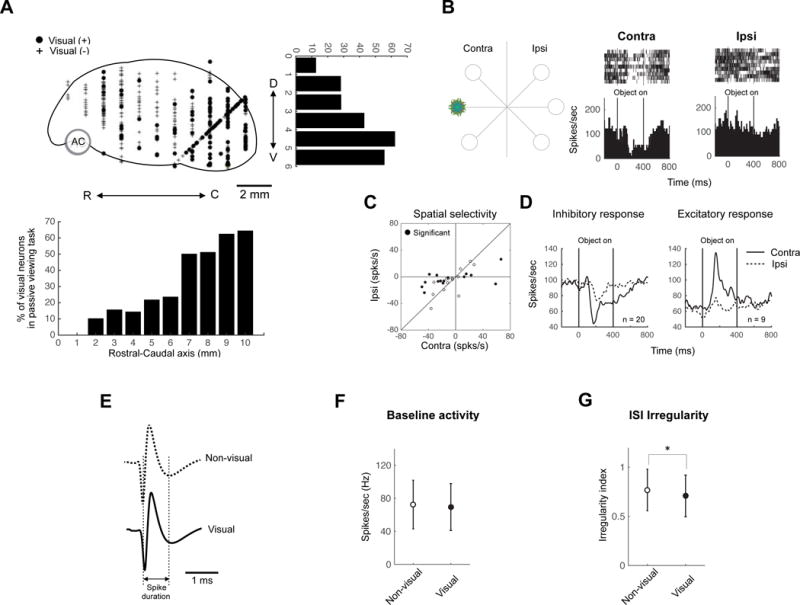
Figure 2. Visual neurons in GPe.

(A) Locations of visually responsive neurons in sagittal view. D, dorsal; V, ventral; R, rostral; C, caudal. Neuronal distributions are projected to rostral-caudal axis (down) and dorsal-ventral axis (right). Number 0 indicates the rostral and dorsal ends of GPe. (B) An example visual response of GPe neuron. One object was presented in contralateral and ipsilateral hemifields to the recording site (left). The example neuron showed inhibitory response to the object presented in contralateral field (middle) but no response to the same one presented in ipsilateral field (right). (C) Comparison between the responses to contralateral objects (abscissa) and ipsilateral objects (ordinate) for individual neurons. The response was determined by the change in activity from the baseline period (−400–0 ms before object presentation) to the test period (50–400 ms after object presentation). (D) Population response of two types of visual neurons. Average neuronal responses (shown by peristimulus time histogram [PSTH]) are aligned on the time of object presentation (0–400 ms). (E–G) Electrophysiological properties of visual and non-visual neurons in GPe. Visual and non-visual neurons had similar spike shapes (E) and baseline activity (F). However visual GPe neuron had lower inter-trial-interval irregularity than non-visual neurons (G) (mean ± SD, * p < 0.05).
