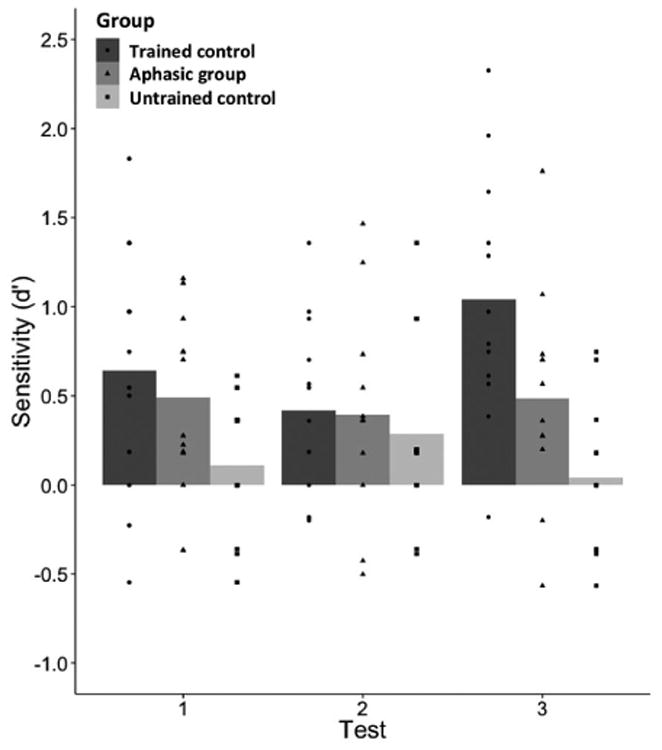
Figure 3.

Artificial grammar judgment sensitivity. Individual d′ scores are shown overlaid on bars representing the average d′ scores for each participant group at Test 1 (day 1 after training), Test 2 (day 2 before training), and Test 3 (day 2 after second training). Higher d′ scores indicate greater sensitivity to the detection of grammatical items.
