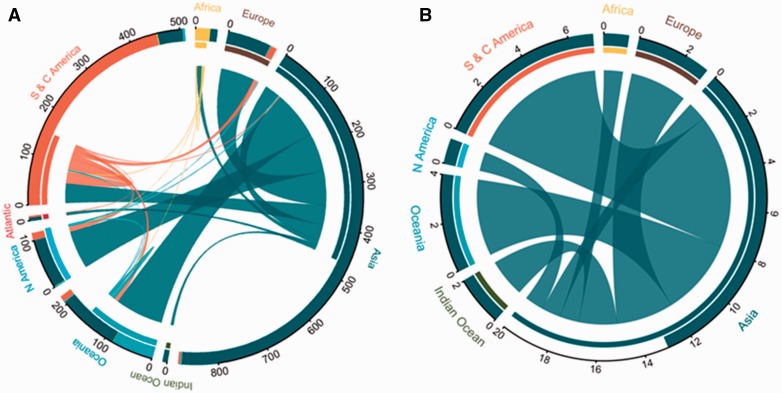
Figure 1.
Connectivity plots indicating the transfer of (A) introduced species and (B) invasive species of bamboos around the world relative to their native region. The thickness of internal lines connecting regions correspond to the diversity (number) of species moved. The outer inset bar graph shows the total count of species in that region (by status), and the inner bar graph represents the flow to and from that region. Regions are colour coded by label names.

