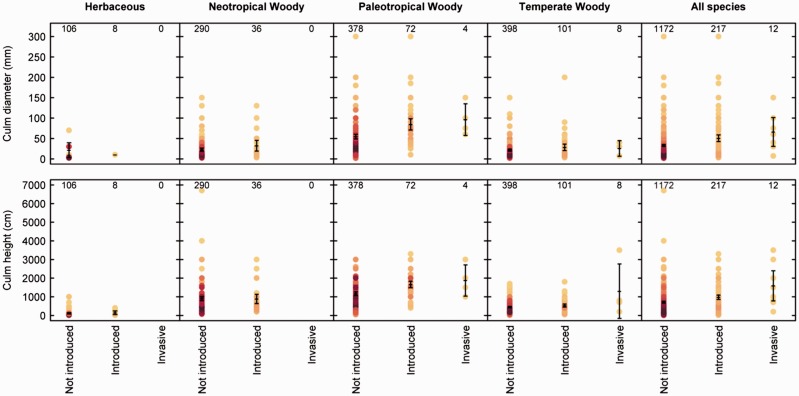
Figure 5.
Culm diameter (mm) and culm height (cm) of bamboo species (error bars indicate 95 % confidence intervals) across lineages, and grouped by status. Shading indicates the number of species at each point, with lighter yellow representing less species and darker red shades representing many species. Numbers at the top of each plot indicate the number of species (in which data were available) for the corresponding status group.

