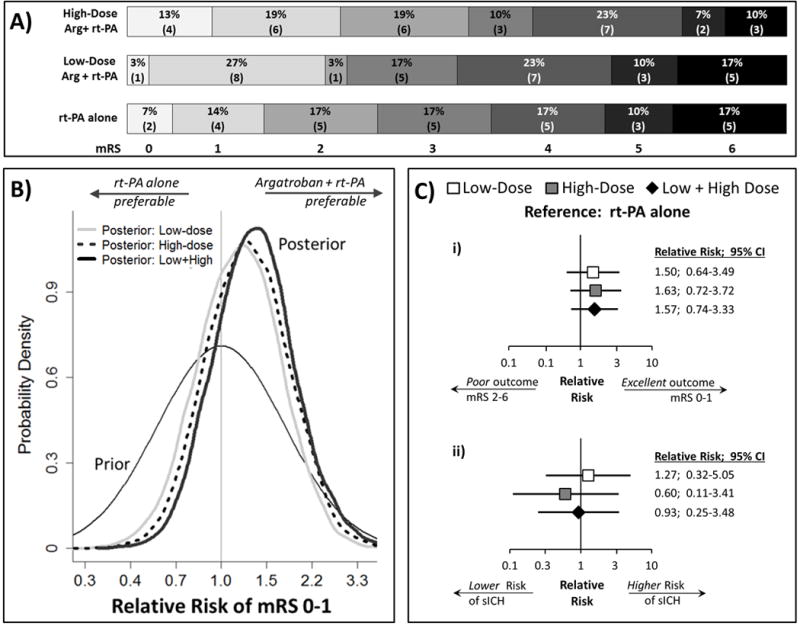
Figure 2.

A) Distribution of 90-day modified Rankin Scale scores. B) Graphical depiction of Bayesian results. The neutral prior is centered at Relative Risk=1.0 indicating a 50:50 chance of argatroban+rt-PA superiority or inferiority. The area under the curve located on the right-hand side of RR=1.0 for each posterior, represents the probability that combination is superior (i.e., RR >1.0) to rt-PA-alone (67%-low; 74%-high and 79%-low+high dose). Note: the x-axis is set to logarithmic scale. C) Forest-plots of i) 90-day excellent clinical outcome; and ii) symptomatic ICH within 48-hours of rt-PA, analyzed using frequentist approach and adjusted for stratification variables.
