Figure 1.
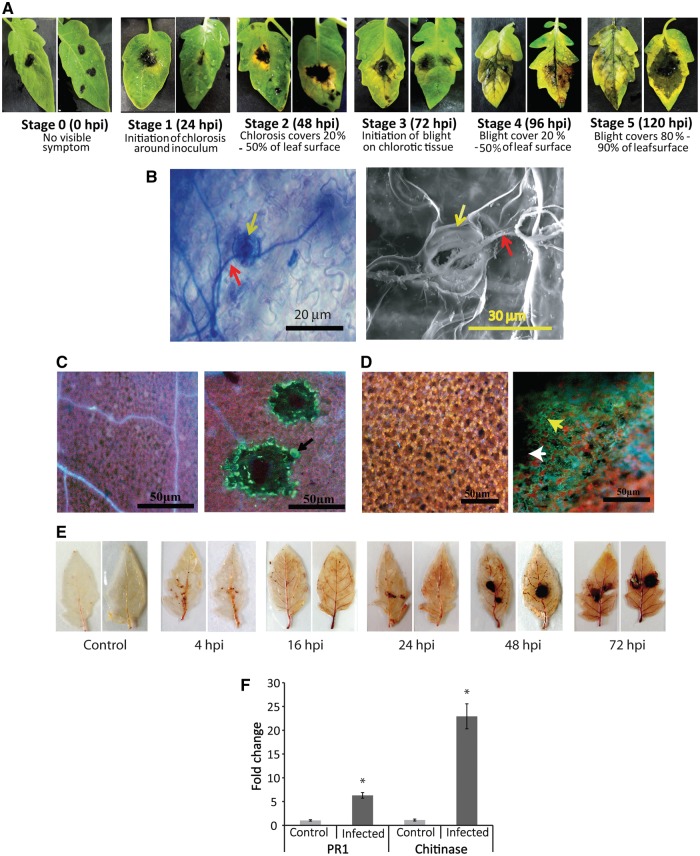
Symptoms in deliberately infected tomato leaves, and characterization of the disease progression. (A) Manifestation of different stages of disease development during Alternaria infection. (B) Trypan blue staining displaying hyphal invasion (red arrow) through stomata (yellow arrow) into the leaf (left panel), right panel shows SEM of infected leaf surface confirming Alternaria hyphal (red arrow) invasion through stomatal opening (yellow arrow). (C) Detection of callose deposition in infected region. Control (mock inoculated, left panel) and infected (right panel) leaf fluorescence images after staining for the detection of callose deposition, showing accumulation of callose indicated by green fluorescence (black arrow) around hyphal mat, as a response to early plant defence. (D) Visualization of nitric oxide (yellow arrow) production at infection site (white arrow) by diaminofluorescein diacetate (DAF-2DA) staining. (E) Assays for detection of time-dependent accumulation of ROS at infection site. Brown coloration around the infection site resulted from DAB staining confirming ROS generation. Production of maximum ROS at 72 hpi is apparent. (F) Quantitative real-time PCR data showing expression level of selected marker genes for biotic stress. Both PR1 and chitinase transcript levels were upregulated compared with the control. Expression level of EF1α was used for normalization. *Significantly changed.

