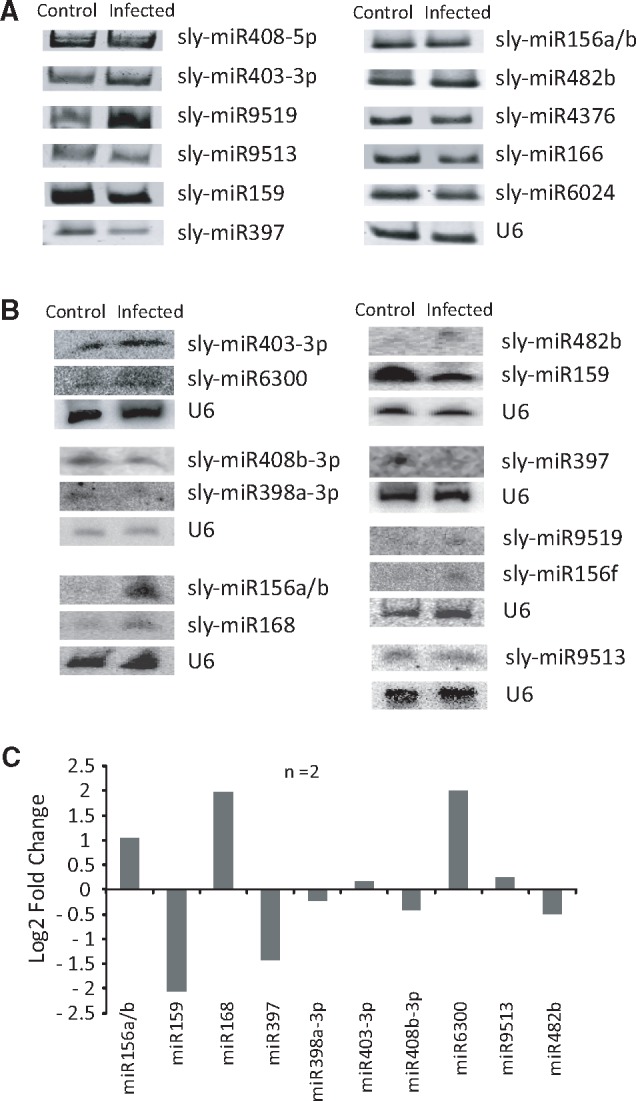
Figure 4.

Validation of expression level of miRNAs using alternative approaches. (A) PAGE photograph of poly A tailing mediated RT-PCR analysis of selected known miRNAs. U6 snRNA expression was monitored as normalization factor. (B) Images of northern blot hybridization analysis of selected known miRNAs. (C) Quantification of band intensity obtained (using ImageQuant ID GEL quantification software) in northern blot analysis (n = 2). Data presented as log2 fold change (normalized intensity of infected/control).
