
Figure 1.
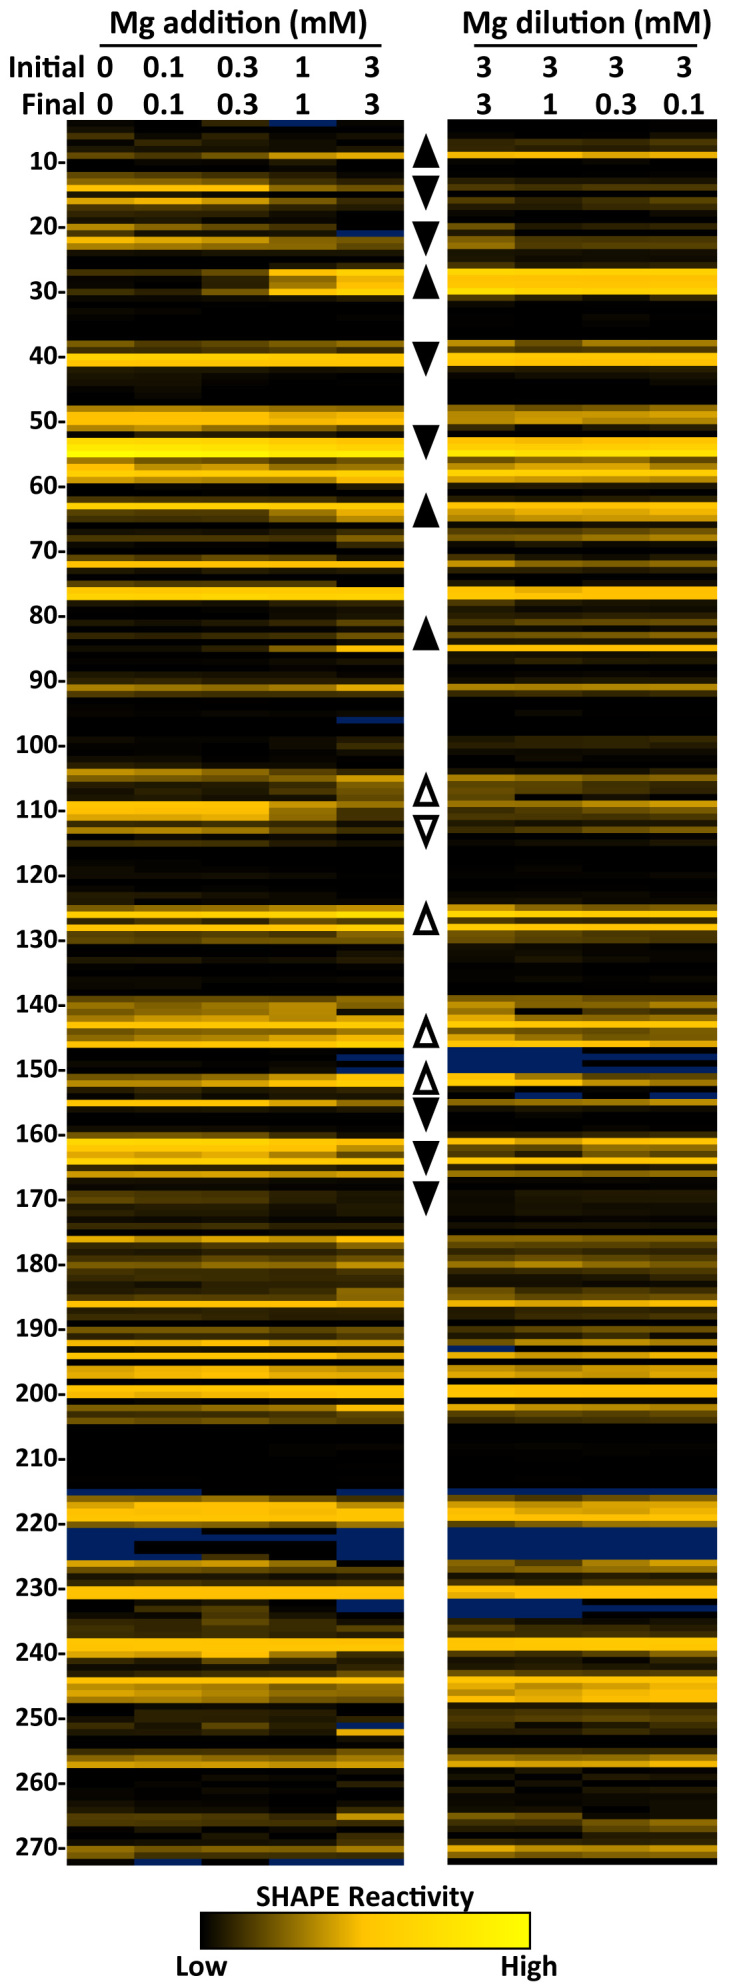
Magnesium induced structure of in vitro 7SK RNA. SHAPE reactivity heat maps showing flexibility of nucleotides 4–272. The color of each cell corresponds to the reactivity of that base from black (non-reactive), through goldenrod (reactive), to yellow (highly reactive). Bases with high background are colored blue. (Left) Magnesium acetate concentrations during the initial folding of 7SK RNA increase as indicated. Regions that change in reactivity are represented by up arrowheads for increases and down arrowheads for decreases. (Right) 7SK RNA was initially folded at 3 mM magnesium and diluted to the indicated concentrations for analysis. Regions that retain 3 mM reactivities are represented by filled arrowheads and open arrowheads represent regions that change after removal of magnesium.