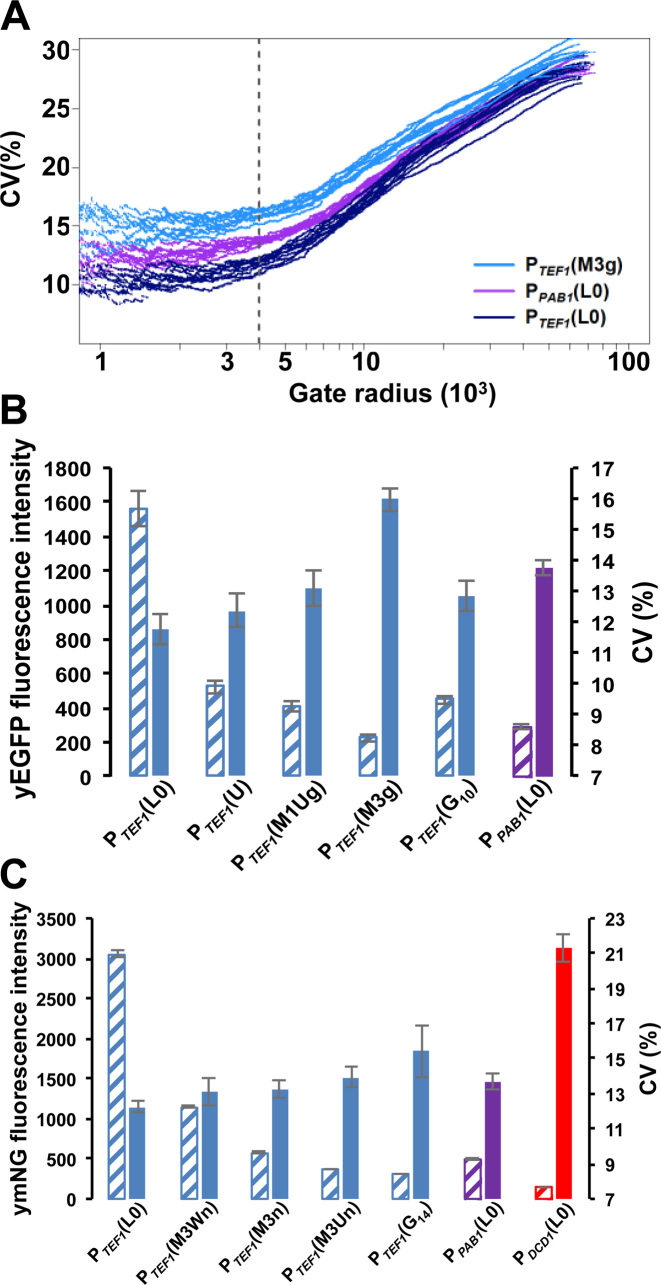
Figure 4.
Gated flow cytometry data for reporter constructs. (A) Analysis of flow cytometry data to determine the relationship between the gate radius and CV(%) for constructs containing yEGFP. Ten experiments were performed for each of the genomic constructs; this panel illustrates the variation in CV values for three of these constructs. Using a gate radius of 4000 (dashed vertical line in panel A), we obtained plots of CV(%; solid bars) versus mean fluorescence intensity values (hatched bars) for yEGFP (B) and for ymNeonGreen (C) constructs. The greater fluorescence intensity of ymNeonGreen enabled us to distinguish fully the fluorescence intensity distributions of PTEF1(M3Un) and PTEF1(G14) from host cell autofluorescence, and to distinguish partially the distribution for PDCD1(L0) (Supplementary Figure S3).

