Figure 4.
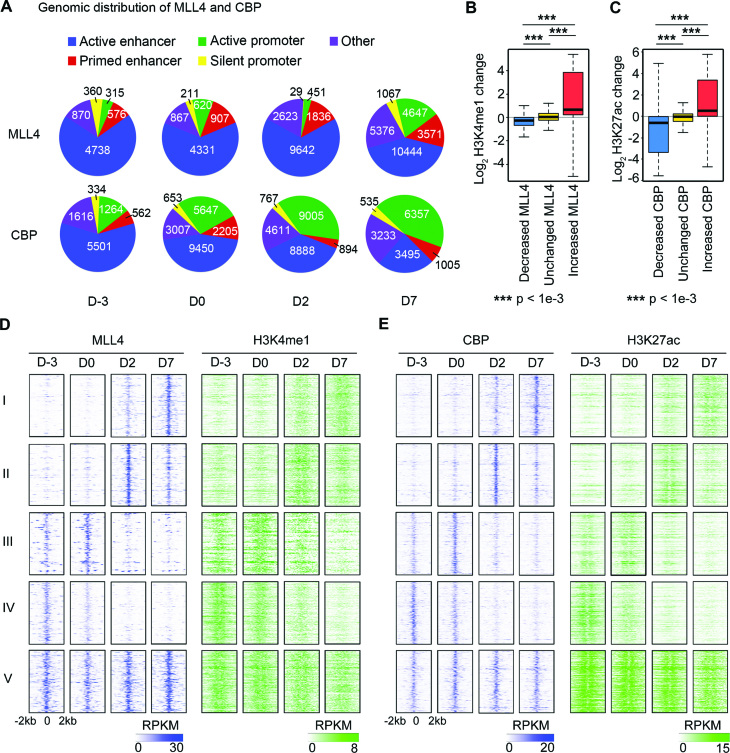
MLL4 and CBP drive the dynamic enhancer epigenome in adipogenesis. Only MLL4 and CBP binding sites within enhancers are included. (A) Genomic distribution of MLL4 and CBP binding in adipogenesis. (B and C) Relationship between changes in MLL4 (B) or CBP (C) binding intensity and their respective histone modification levels. MLL4 and CBP sites were classified into three groups according to their changes in binding intensity between neighboring time points: decreased, unchanged and increased (see Supplementary Figure S2A for details). (D and E) MLL4 and CBP drive the dynamics of their respective histone modifications on enhancers. Only MLL4/CBP binding sites corresponding to the most enriched temporal pattern for each group were included when generating the heat maps. The enrichment of temporal MLL4/CBP binding patterns is shown in Supplementary Figure S2B. (D) Heat maps of MLL4 and H3K4me1 on enhancer MLL4 binding sites. (E) Heat maps of CBP and H3K27ac on enhancer CBP binding sites.

