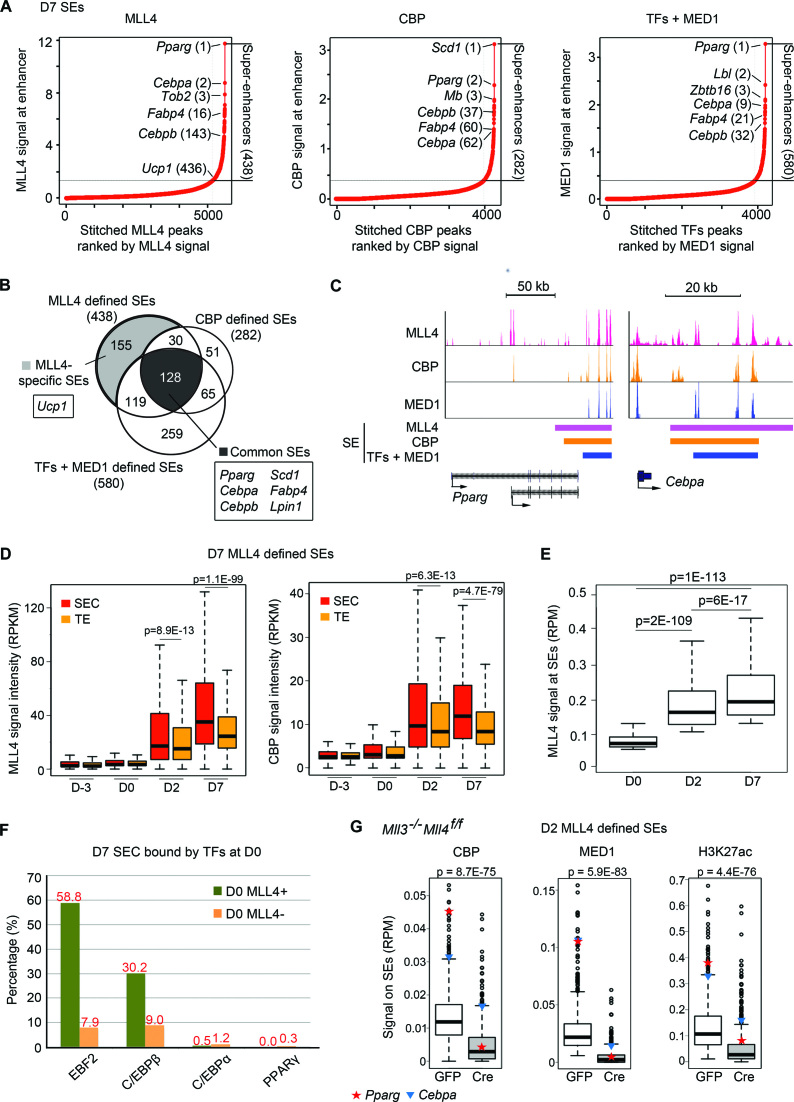
Figure 6.
MLL4 identifies and is required for super-enhancer (SE) formation in adipogenesis. (A–C) MLL4 and CBP identify SEs in D7 brown adipocytes. (A) D7 SEs identified using MLL4, CBP or TFs + MED1 (29). (B) Venn diagram showing the overlaps between three groups of SEs identified in (A). Representative genes associated with MLL4-specific and common SEs are indicated. (C) SEs on Pparg and Cebpa loci. SE regions identified by each approach are indicated by color bars. (D) MLL4 and CBP are preferentially enriched on SE constituents (SECs). MLL4 and CBP signal levels are shown for SECs and typical enhancers (TEs) from D-3 to D7. SEs were identified using MLL4 in D7 brown adipocytes. See Supplementary Figure S5 for results on SEs identified using CBP or TFs + MED1. (E) MLL4 signal intensities on SEs increase from D0 to D7. SEs are defined by MLL4 at each time point. (F) D7 SECs pre-marked by MLL4 at D0 are enriched with the binding of EBF2 and C/EBPβ but not C/EBPα and PPARγ. (G) Deletion of Mll4 from Mll3 KO preadipocytes severely decreases CBP, MED1 and H3K27ac levels at SEs identified by MLL4 in D2 cells. D2 SEs were identified by MLL4 as shown in Supplementary Figure S7. The signal levels on SEs of Pparg (red star) and Cebpa (blue triangle) are indicated.

