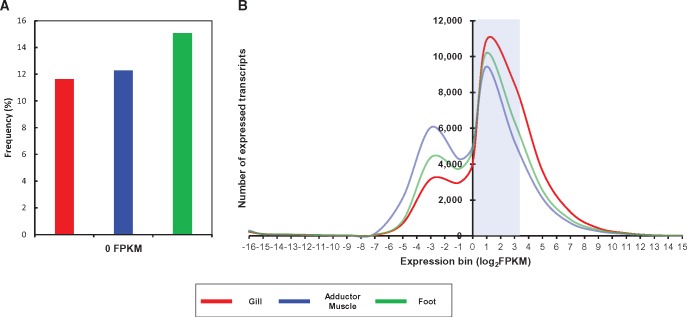
Fig. 4.—
Bioinformatic analysis for transcript expression profile. (A) Frequency of transcripts with 0 FPKM in each tissue. (B) Distribution of FPKM values for transcripts expressed in each tissue. The x axis and y axis indicate the number of expressed transcripts and log-transformed FPKM values of transcripts (FPKM > 0) from three tissues, respectively. The blue box denotes the majority of transcripts (1 < FPKM < 10).

