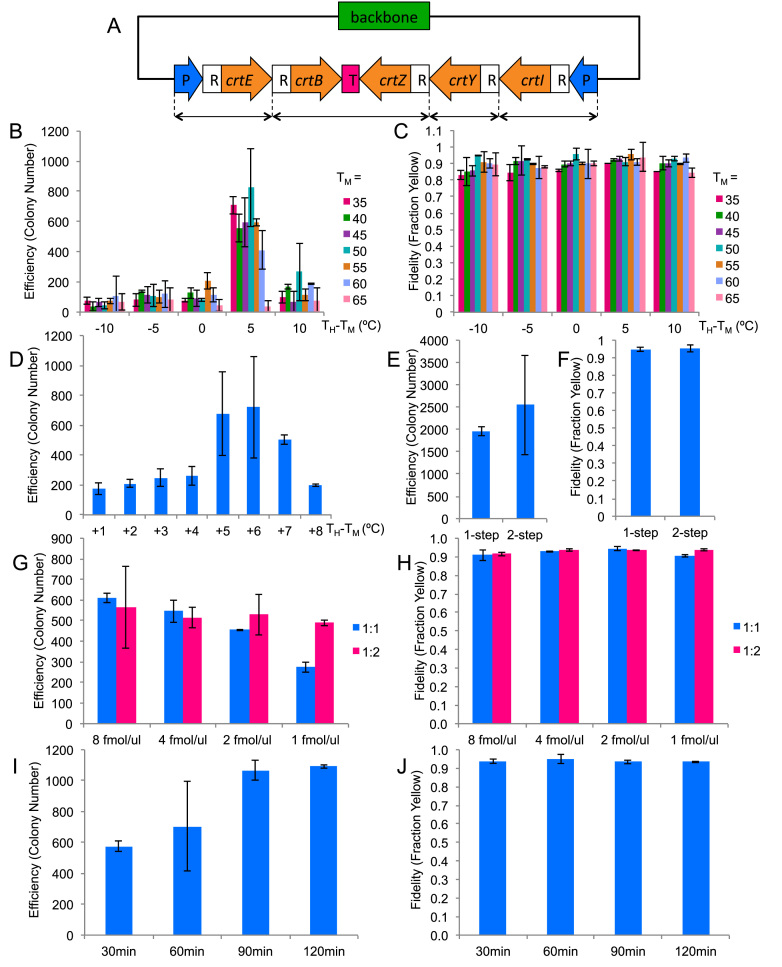
Figure 2.
TPA optimization based on five-fragments assembly. The columns represent the averages of two independent experiments, and the error bars represent the standard deviations. (A) The zeaxanthin pathway plasmid used for the optimization experiments. CrtE, B, Z, Y, I are the coding regions for the enzymes in the pathway. P represents promoter, R represents RBS and T represents terminator. The double-headed arrows at the bottom denote how the pathway has been broken up. (B and C) Efficiency and fidelity as a function of junction TM and hybridization TH. Horizontal axis represents the difference between TH and TM. (D) Efficiency as a function of TH for TM = 50°C. (E & F) Efficiency and fidelity as a function of annealing protocol. (G & H) Efficiency and fidelity as a function of DNA input amount and backbone:insert ratio. (I & J) Efficiency and fidelity as a function of hybridization time.

