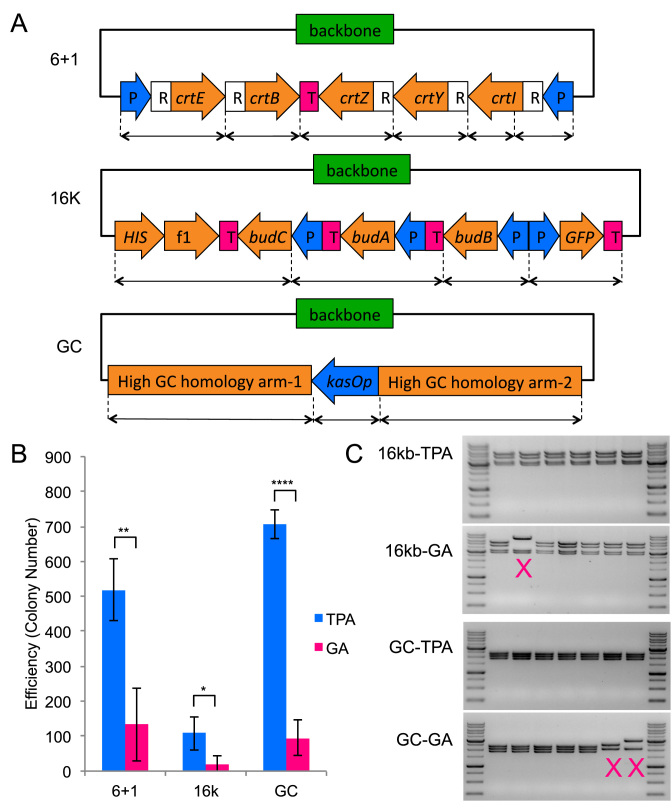
Figure 4.
TPA versus Gibson Assembly (GA). The columns represent the averages of four independent experiments, and the error bars represent the standard deviation. All TPA data points have been obtained using the two-step protocol. (A) Schematic of the three constructs used for this comparison. kasOp is a Streptomyces promoter. (B) Efficiency comparison between TPA and GA for the three different assemblies. (*P < 0.05, **P < 0.01, ****P < 0.0001) (C) Restriction digestion of TPA and GA clones. Incorrect patterns are marked with an ‘X’. For the full set of restriction digest verification data, refer to Supplementary Figure S6.

