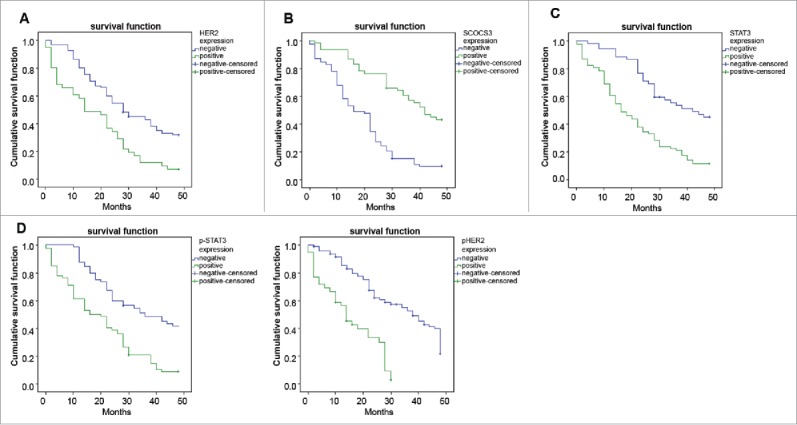
Figure 4.

Correlations of the survival curves of patients within 24 months with HER2, p-HER2, SOCS3, STAT3 and p-STAT3.
Note: (A) Correlation between expression of HER2 and the survival time of patients; (B) correlation between expression of SOCS3 and the survival time of patients; (C) correlation between expression of STAT3 and the survival time of patients; (D) correlation between expression of p-STAT3 and the survival time of patients; (E) correlation between expression of p-HER2 and the survival time of patients; HER2, human epidermal growth factor receptor 2; p-HER2, phosphorylated HER2; SOCS3, suppressors of cytokine signaling 3; STAT3, signal transducer and activator of transcription 3; p-STAT3, phosphorylated STAT3.
