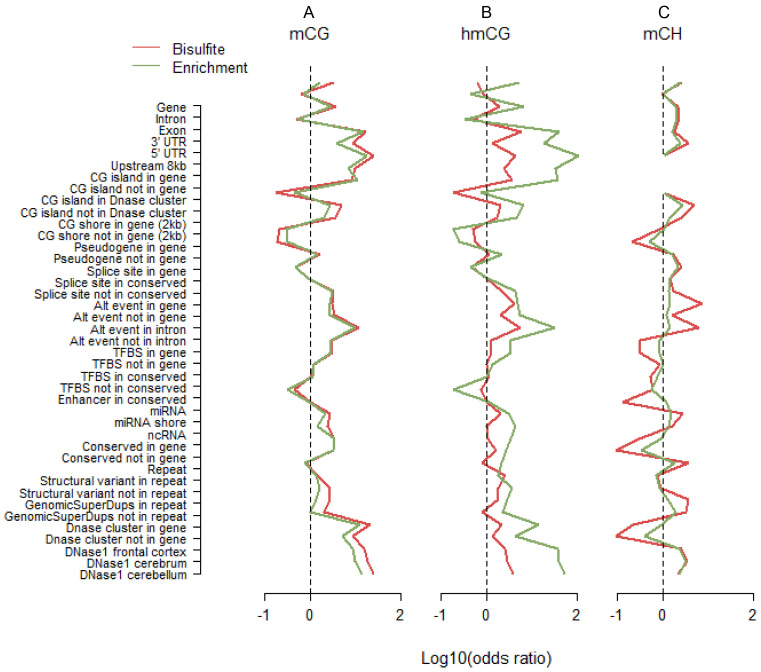
Figure 4.
Methylation profiles across genomic features. We classified loci as methylated versus non-methylated, and genomic features as present versus absent. Using these 2 by 2 tables as input, we calculated odds ratios that indicated whether sites in the studied featured were more likely to be methylated compared to sites not in this feature. For the purpose of plotting we took the log10 of the odds ratio. Thus, a value of zero, log10(1) = 0, indicated by the dashed lines in the figures, means no enrichment of methylated sites. Odds ratios for mCH were calculated using only cytosines located more than the maximum fragment size away from CG dinucleotides. This explains the missing values in panel C for CG islands, as those regions contain no such cytosines. The full list of tested features is provided in Supplementary Table S5. For assaying mCG, profiles across genomic features were very similar for WGB and MBD (A). This suggested that both technologies covered similar features. For hmCG, the two patterns were also very comparable but the odds ratios were systematically larger for hMe-Seal (B). This is unlikely the result of sampling variation because the effects (i) were in the same direction, and (ii) displayed a pattern comparable to that observed for mCG (A). Instead, it suggested that hMe-Seal outperformed TAB in terms of more accurately classifying methylation status. In contrast, enrichment for mCH had an opposite relationship to WGB (C). Although, patterns were still similar, odds ratios were smaller for MBD-DIP suggesting it may be less accurate.

