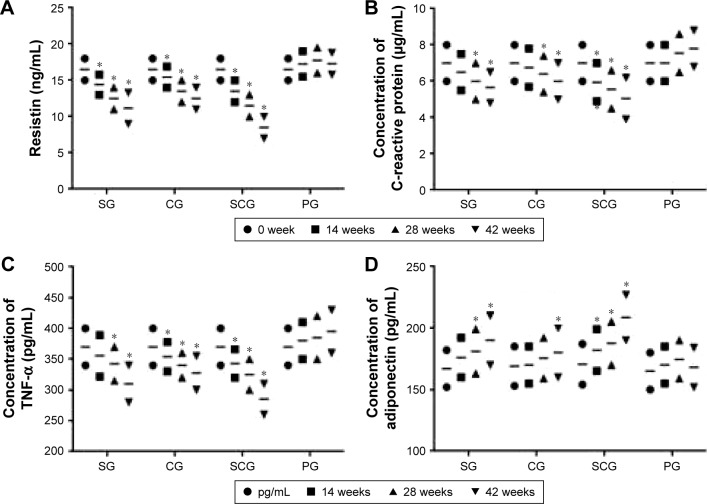
Figure 3.
Changes of mean concentrations of (A) resistin (ng/mL), (B) C-reactive protein (mg/L), (C) TNF-α (pg/mL), and (D) adiponectin (pg/mL) between SCG and SG groups in a 42-week follow-up.
Note: *P<0.05 versus PG.
Abbreviations: SCG, sitagliptin and chitosan oligosaccharide group; CG, chitosan oligosaccharide group; SG, sitagliptin group; PG, placebo group; TNF, tumor necrosis factor.

