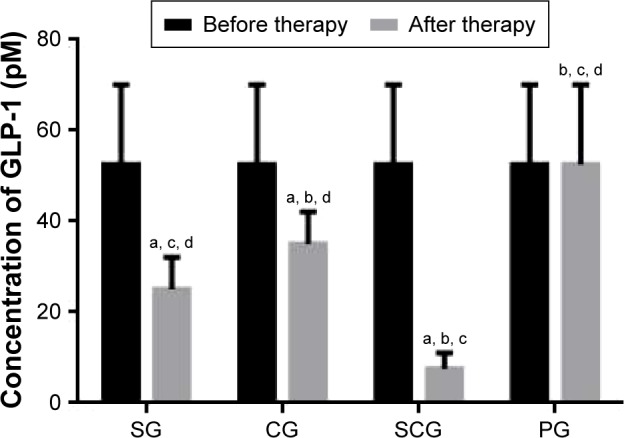
Figure 4.

Serum concentration of GLP-1 in different groups.
Notes: Data presented as mean ± SD. aP<0.05 versus PG, bP<0.05 versus SG, cP<0.05 versus CG, and dP<0.05 versus SCG.
Abbreviations: GLP-1, glucagon-like peptide 1; SD, standard deviation; SCG, sitagliptin and chitosan oligosaccharide group; CG, chitosan oligosaccharide group; SG, sitagliptin group; PG, placebo group.
