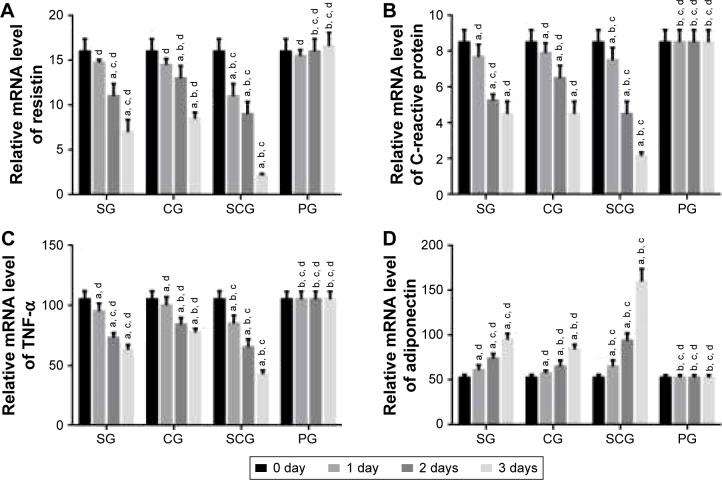
Figure 5.
Real-time qPCR analysis of relative mRNA levels of (A) resistin, (B) C-reactive protein, (C) TNF-α, and (D) adiponectin between SCG and SG groups in human pancreatic cancer cell lines 3T3-L1 and 3T3-F442A.
Note: aP<0.05 versus PG, bP<0.05 versus SG, cP<0.05 versus CG, and dP<0.05 versus SCG.
Abbreviations: SCG, sitagliptin and chitosan oligosaccharide group; CG, chitosan oligosaccharide group; SG, sitagliptin group; PG, placebo group; qPCR, quantitative polymerase chain reaction; TNF, tumor necrosis factor.

