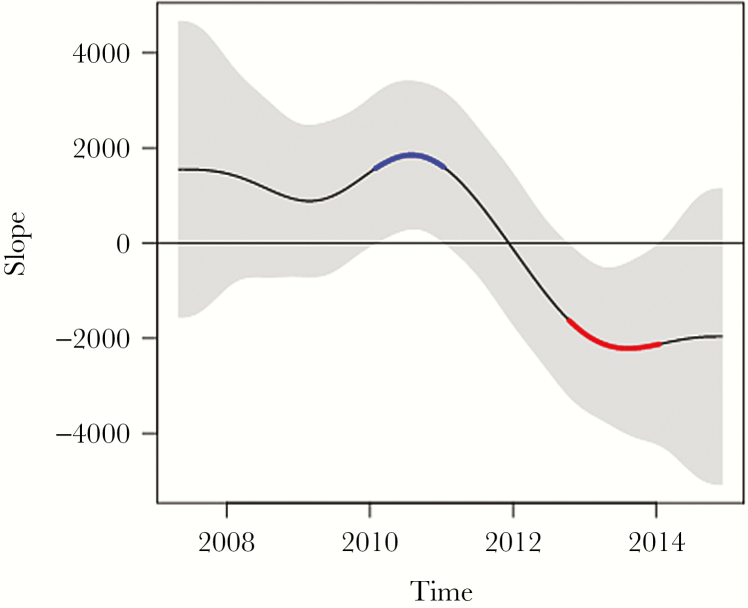
Figure 3.
The rate of change (slope) in susceptibility/resistance during the times of significant change. First derivative (ie, slope) of the fitted spline. The gray band is a 95% simultaneous confidence interval. Sections of the slope where the (gray-shaded) confidence interval does not include zero are 2 periods of statistically significant change in percentage resistance. The curve in blue corresponds to the derivative line being above the zero horizontal line and, hence, marks a significant increase in (centered, × 100) resistance, and the curve in red corresponds to the derivative line being below the zero line and, therefore, indicates a period of significant decrease in resistance.

