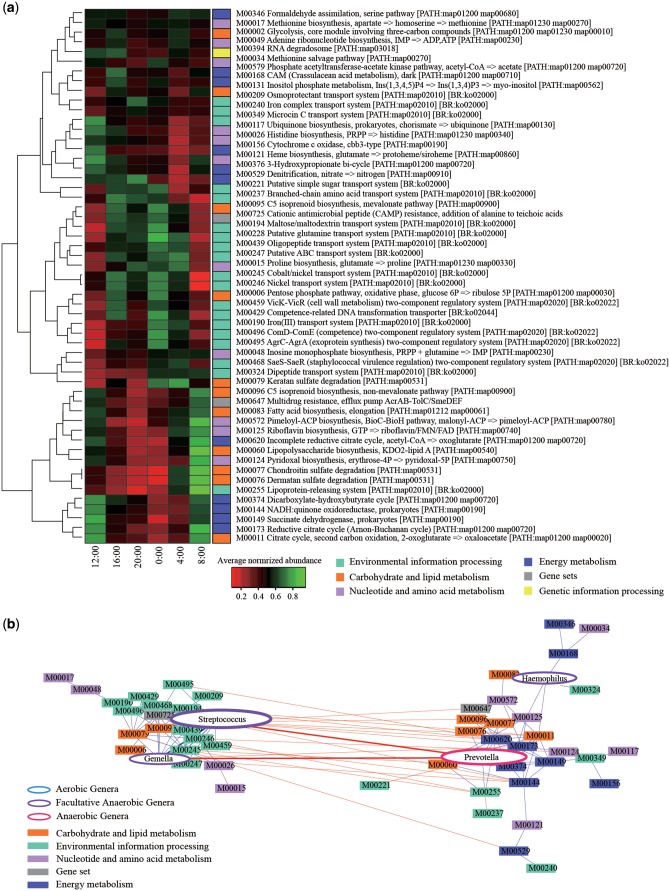
Figure 4.
The KEGG modules having the circadian oscillation. (a) Heatmap of the relative gene abundances of 55 KEGG modules. Colour gradient indicate the degree of the average abundance of the KEGG modules which had statistically significance in at least five subjects. Colours on right side indicate six upper functional categories of the KEGG modules. (b) Network of the KEGG modules and genera. The results for the significant correlation between the 55 KEGG modules and four genera in more than five subjects are shown. Interactions between nodes were calculated by Spearman’s rank correlation and correlations with P >0.05 or P <0.6 are removed. Coloured rectangles correspond to the KEGG modules and ellipse nodes signify the genera. Size of ellipse nodes corresponds to the relative abundance of the genera. Blue and red lines indicate positive and negative correlation, respectively.

