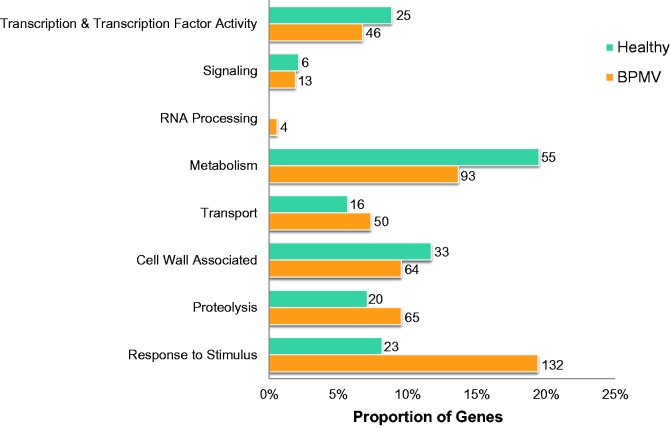
Fig. 2.—
Distribution of differentially expressed genes among functional categories of virus-infected and healthy soybean. Bars indicate the proportion of genes in each category: orange, BPMV-infected plants; light blue, healthy plants. Number of genes in each category is given beside each bar. Percentages do not total to 100 as not all categories are shown.

