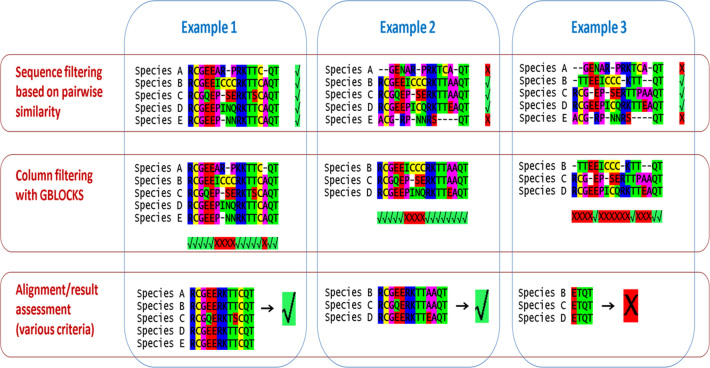
Figure 2.
Schematic illustration of the filtering in PosiGene. Three approaches that are conducted at different steps of the program are depicted. The red marked ‘X’ means that the respective sequence/species, alignment column or the whole alignment/result were removed from further analysis, while the green marked √ means that the filter was passed. The shown examples are artificial and serve for demonstration only. In particular, for Example 3, the minimum length for a block of accepted alignment columns is depicted shorter (one codon/amino-acid) than in real application. The reason why the alignment in Example 3 does not pass the filter would be that a too small fraction of the alignment passed the column filter. For compact illustration, all steps are shown on protein level, while the column filtering works in reality on codon level.

