Figure 2.
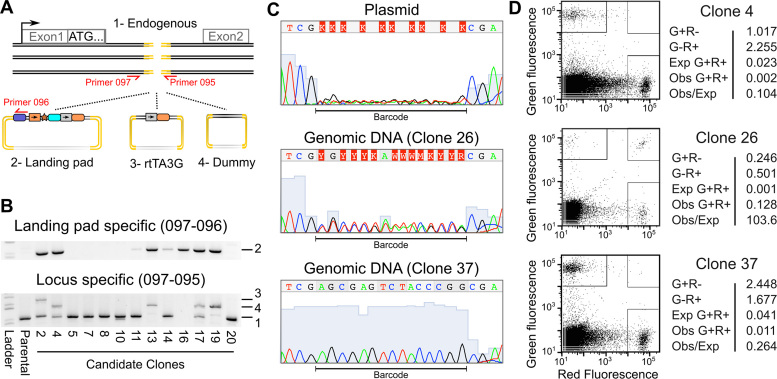
Validation of single landing pad genomic insertion at the desired locus. (A) A schematic illustrating the three homology repair templates and the primer pairs used to identify their insertion is shown. (B) Agarose gels of the products of the landing pad specific (top panel) or AAVS1 locus specific PCR amplification (bottom panel) are shown. Numbers indicate expected band sizes for the unmodified locus (1), landing pad insertion (2), rtTA3G insertion (3) or dummy insertion (4). (C) Sanger sequencing traces are shown for the degenerate barcode sequence in the landing pad homology repair template plasmid preparation and for two candidate landing pad clones. (D) Candidate landing pad clones were transfected with a mixture of attB-EGFP and attB-mCherry recombination plasmids and the Bxb1 expression plasmid. The green and red fluorescence levels for three transfected candidate clones are shown (left panels). Boxes indicate cells considered EGFP+, mCherry+ or EGFP+/mCherry+. The percentages of live cells in each category along with the expected number of EGFP+/mCherry+ cells based on the number of EGFP+ and mCherry+ cells are shown (right panels).

