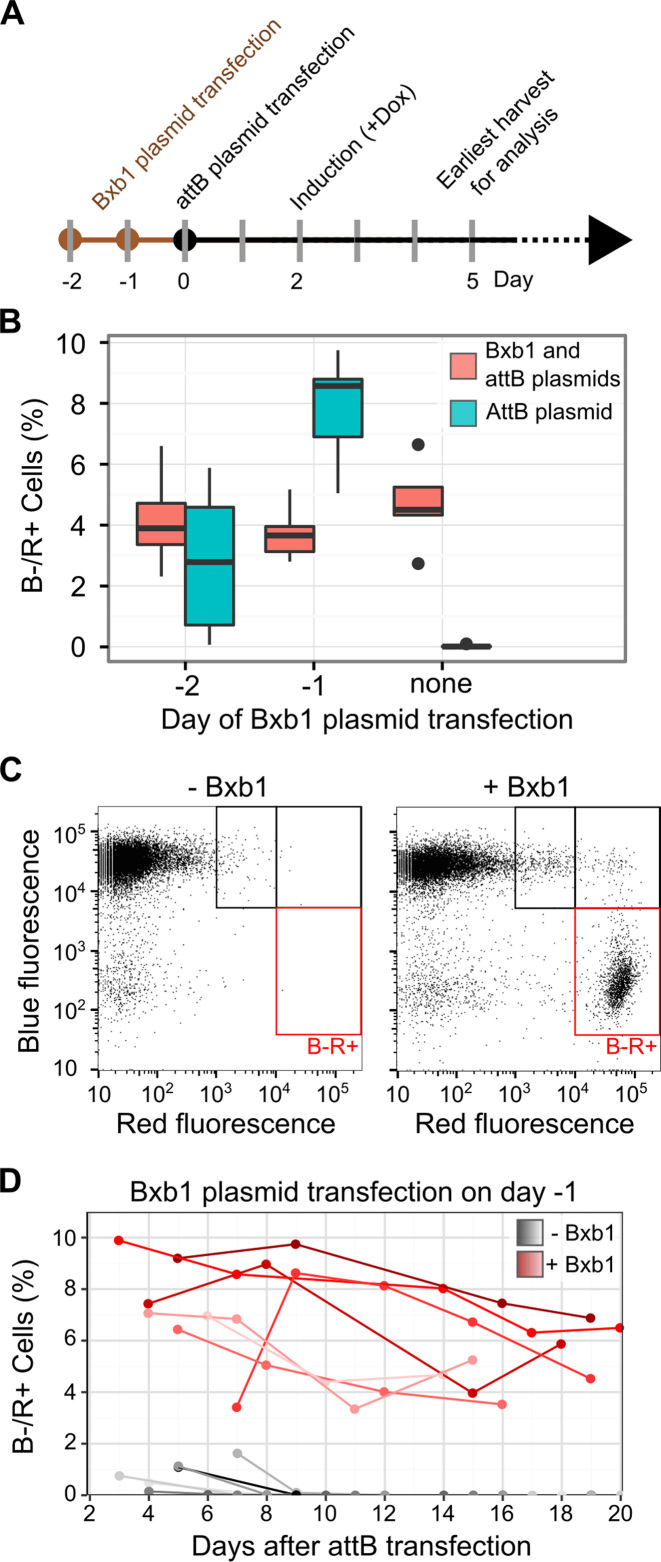
Figure 3.
Optimization of plasmid transfection and transgene expression. (A) A timeline of plasmid transfection, Tet promoter induction, and fluorescent reporter analysis by flow cytometry is shown. (B) HEK 293T TetBxb1BFP cells were transfected with Bxb1 expression plasmid one or two days before transfection with either attB-mCherry recombination plasmid alone (blue) or a 1:1 mixture of attB-mCherry and Bxb1 expression plasmids (red). Two days after attB-mCherry transfection, expression was induced with doxycycline. Three days later, flow cytometry was used to assess the fraction of BFP–/mCherry+ cells. Boxplots represent the results of seven replicates. (C) A representative scatterplot of red and blue fluorescence of HEK 293T TetBxb1BFP cells transfected with attB-mCherry, either with or without the Bxb1 expression plasmid, is shown. Black boxes denote cells likely exhibiting leaky plasmid expression or expression following random transgene integration behind a promoter. Red boxes denote BFP–/mCherry+ cells where the attB-mCherry plasmid has successfully recombined into the landing pad. (D) The percentage of BFP–/mCherry+ HEK 293T TetBxb1BFP cells after transfection with the attB-mCherry recombination plasmid as measured by flow cytometry is shown. Cells were transfected in the presence (red lines) or absence (gray lines) of previously transfected Bxb1 recombinase expression vector. Lines represent BFP–/mCherry+ percentages over time for seven replicates.

