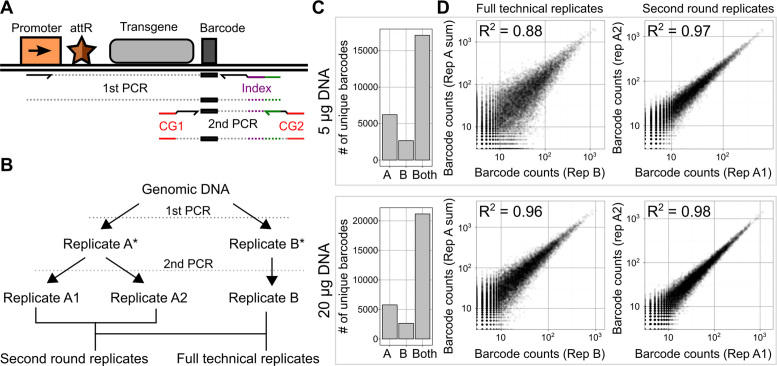
Figure 4.
Creating and quantifying a large library of recombinants using the landing pad. (A) A schematic of the sequential PCR strategy used to selectively amplify a recombined barcode and generate a sequencing-compatible amplicon is shown (CG: Illumina cluster generating sequences, attR: recombination junction). (B) A schematic of technical replicate amplifications performed to characterize precision in preparation and sequencing of recombined barcodes is shown. Sample intermediates are denoted by an asterisk. (C) High throughput sequencing of amplicons generated with either 5 or 20 μg of input DNA revealed the number of unique barcodes observed multiple times only in full technical replicate A, only in full technical replicate B, or in both replicates (left). (D) Scatterplots of the counts of the unique barcodes appearing in both full technical replicates (center) or both second round replicates (right) are shown. R2 values represent squared Pearson correlation coefficients.

