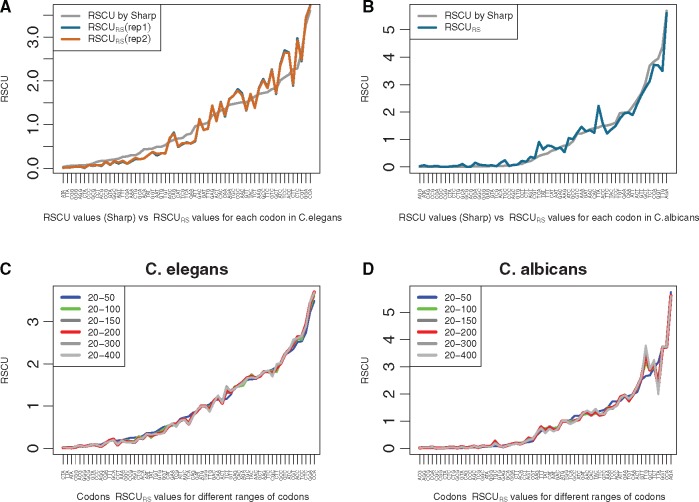
Figure 1.
Comparison of the strength of codon usage bias as measured by the RSCU as originally defined by Sharp et al., and by the RSCURS which is introduced in this work. Both measures are plotted for a subset of highly expressed genes. The RSCU is computed for each codon of an amino acid: it multiplies the relative observed frequency of this codon among all possible codons for the corresponding amino acid by the number of possible codons. In all graphs, the codons on x-axis are ordered by increasing RSCU values computed by Sharp et al. (A) Comparison of RSCU values of Sharp and RSCURS values in C. elegans (in two replicates). Both replicate curves for RSCURS are extremely close from each other, and they closely follow that from Sharp. (B) Comparison of RSCU values of Sharp and RSCURS values in C. albicans. (C) and (D). Comparison of eight RSCURS curves obtained with codons counts computed in different ranges of codons starting with 20th codon and ending between the 50th and the 400th codons, respectively, in C. elegans (C) and in C. albicans (D). Apart for the smallest range of codons (i.e. [20-50]) all curves are very close to each other, thereby showing the robustness of with respect to the range of codons taken into account. One observes that RSCURS values reach higher values in the yeast species than in the worm species. Refer to the online version for colors.

