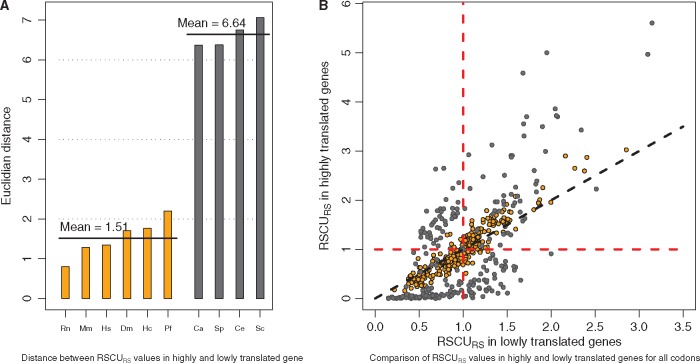
Figure 2.
Differences in codon usage bias between lowly and highly translated genes. (A) Euclidean distance between RSCURS of lowly and highly translated genes was computed for ten species. This distance clearly partitions the species in two groups: the mean euclidean distance is 1.51 for group 1 (left, in orange), and is 6.64 for group 2 (right, in grey). Group 2 comprises C. albicans, S. cerevisiae, S. pombe and C. elegans, while group 1 comprises all vertebrates, D. melanogaster, P. falciparum and H. capsulatum. (B) For each species, comparison of the RSCURS of all codons between lowly and highly translated genes (ltg vs htg). Codons from group 1 species (containing the vertebrates) are shown as orange circles, while codons from group 2 species (that of the budding yeast) as gray circles. A point near the diagonal indicates a similar behavior in ltg and htg. The further apart the point from the diagonal, the higher the bias of that codon. Refer to the online version for colors.

