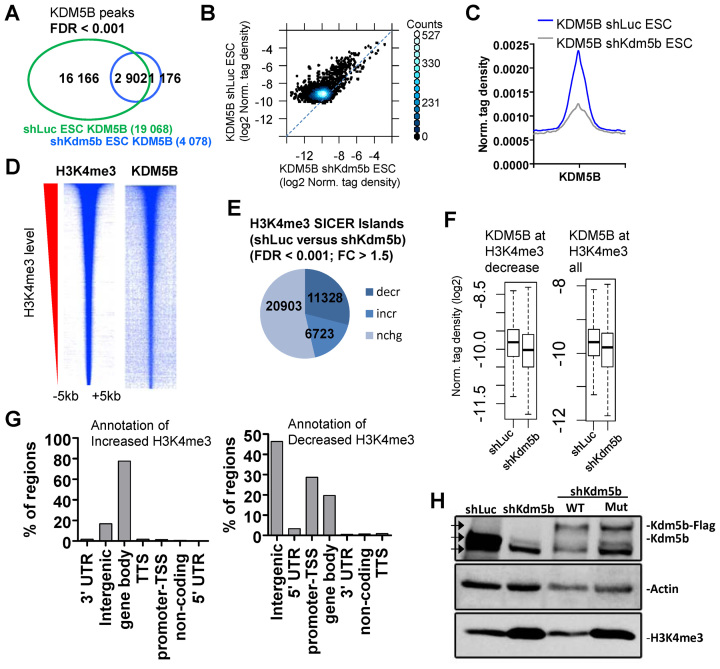
Figure 1.
KDM5B regulates H3K4me3 in ES cells. (A) Venn diagram showing overlap of KDM5B in control (shLuc) and KDM5B-depleted (shKdm5b) ES cells (See ‘Materials and Methods’ section for SICER-analysis; FDR < 0.001). (B) Scatter plot and (C) average profile of KDM5B densities in shLuc and shKdm5b ES cells. (D) Heat maps of KDM5B and H3K4me3 densities at H3K4me3 regions in ES cells. (E) Depletion of KDM5B leads to decreased H3K4me3 levels at promoters and increased levels in gene body regions (See ‘Materials and Methods’ section for SICER-analysis; fold-change > 1.5, FDR < 0.001). (F) Boxplots of KDM5B densities in shLuc and shKdm5b ES cells at H3K4me3 regions. (G) Annotation of H3K4me3 regions using HOMER (34) software. (H) Western blot of KDM5B and H3K4me3 in shLuc, shKdm5b, shKdm5b+ wild-type KDM5B (WT), shKdm5b+ mutant KDM5B (H499A; mut). Note the increased levels of H3K4me3 in shKdm5b and shKdm5b+mut ES cells relative to control (shLuc) and shKdm5b+WT ES cells. The three arrowheads in the KDM5B western blot represent the size of endogenous KDM5B (middle arrow), FLAG-tagged KDM5B (top arrow) and a non-specific band (bottom arrow).

