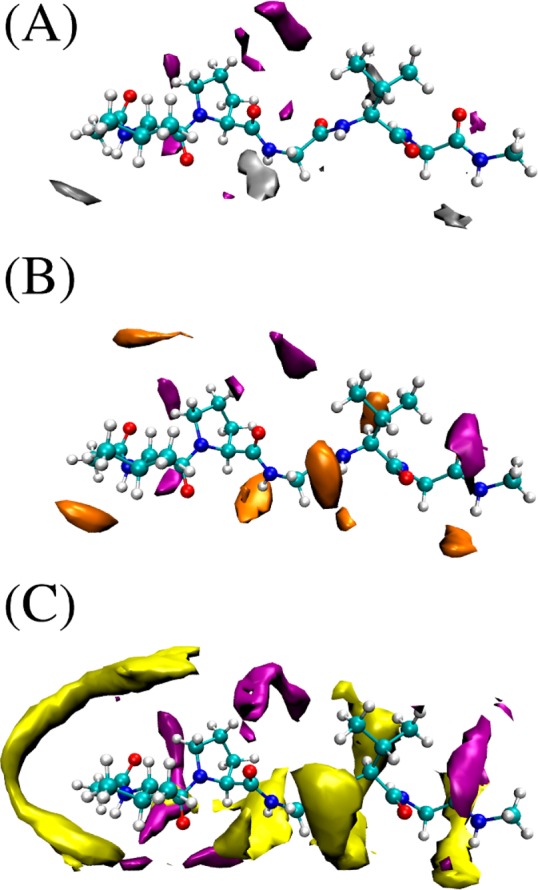
Figure 5.

Spatial density maps of the ions, as obtained from all atom MD simulations. (A) This snapshot shows the depletion of Gnd2SO4 (Gnd+ in purple and SO42– in silver) from the vicinity of the VPGVG pentapeptide. (B) GndCl (Cl– in orange) and (C) GndSCN (SCN– in yellow). The contours plotted for each ion correspond to 4× the bulk density for all three snapshots.
