
Figure 2.
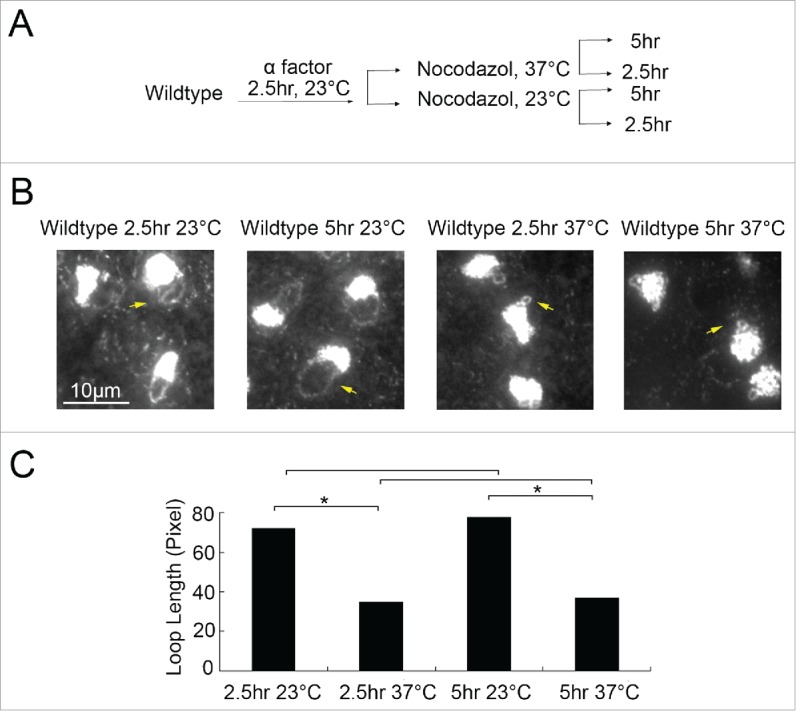
Temperature-induced hypercondensation is not based on increased condensation rates. (A) Schematic of synchronization and experimental procedure performed on wildtype cells (YBS1019). (B) Micrographs of chromosome masses and rDNA loops detected by DAPI staining. Yellow arrows point to rDNA loops at 23°C and diminished loops at 37°C. (C) Quantification and statistical analyses of rDNA loop lengths in each experimental group (N = 50 cells for each treatment, Pvalue = 0.149 for 23 °C 2.5 hr vs 5hr; P-value = 0.346 for 37 °C 2.5 hr vs 5hr; P-value = 5.54E-20 for 23 °C 2.5 hr vs 37 °C 2.5hr; P-value = 2.18E-20 for 23 °C 5 hr vs 37 °C 5hr; P-value = 5.90E-19 for 23 °C 2.5 hr vs 37 °C 5hr).