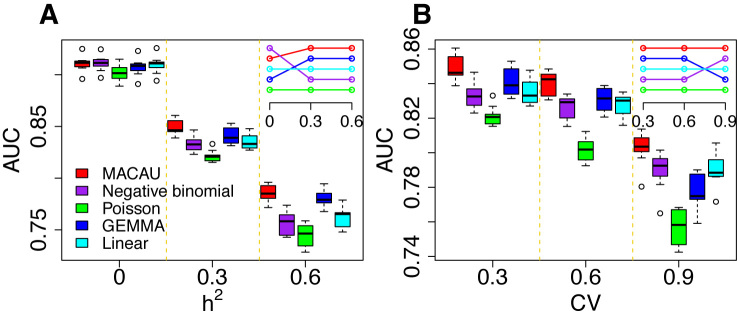
Figure 3.
MACAU exhibits increased power to detect true positive DE genes across a range of simulation settings. Area under the curve (AUC) is shown as a measure of performance for MACAU (red), Negative binomial (purple), Poisson (green), GEMMA (blue), and Linear (cyan). Each simulation setting consists of 10 simulation replicates, and each replicate includes 10 000 simulated genes, with 1 000 DE and 9 000 non-DE. We used n = 63, hx2 = 0.4, PVE = 0.25, and σ2 = 0.25. In (A) we increased h2 while maintaining CV = 0.3 and in (B) we increased CV while maintaining h2 = 0.3. Boxplots of AUC across replicates for different methods show that (A) heritability (h2) influences the relative performance of the methods that account for sample non-independence (MACAU and GEMMA) compared to the methods that do not (negative binomial, Poisson, linear); (B) variation in total read counts across individuals, measured by the coefficient of variation (CV), influences the relative performance of GEMMA and negative binomial. Insets in the two figures show the rank of different methods, where the top row represents the highest rank.

