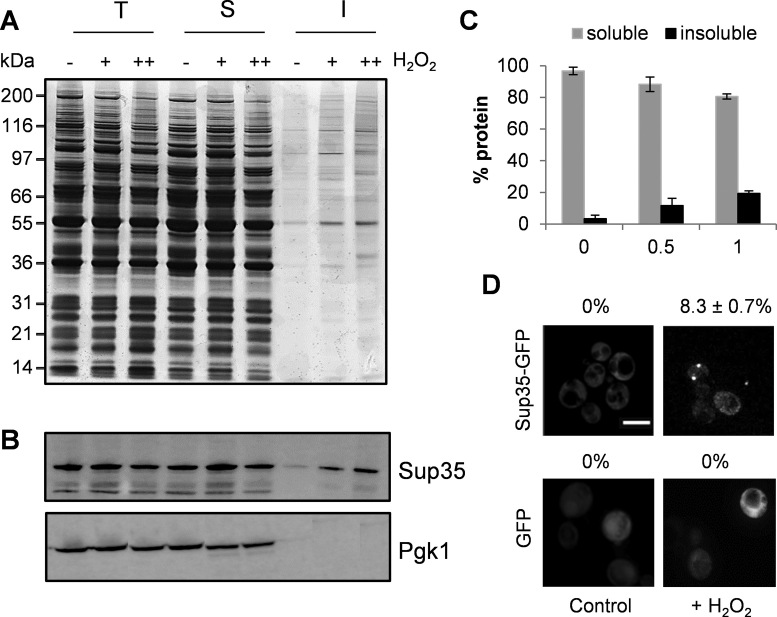
Figure 6.
Aggregation of Sup35 in response to H2O2 stress. (A) Protein aggregates were isolated from the wild-type strain grown in the presence of 0.5 mM (+) or 1 mM (++) H2O2 for 6 h and analyzed by sodium dodecyl sulphate-polyacrylamide gel electrophoresis (SDS-PAGE) and silver staining. T, total cell extracts; S, soluble fraction; I, insoluble aggregate fraction. Four-times as much of the insoluble fraction was loaded relative to the total or soluble fractions to aid visualization. (B) The same protein samples as for panel A were analyzed by western blotting using antibodies that recognize Sup35 and Pgk1 as a loading control. (C) Quantification of soluble and insoluble Sup35 (percentage of total) as shown in panel B from triplicate experiments. Error bars denote SD. (D) Sup35-GFP or GFP was visualized in the wild-type strain exposed to 1 mM H2O2 for 6 h. Examples of cells containing visible Sup35-GFP puncta are shown. The percentage of cells containing visible puncta was quantified from three independent biological repeat experiments ± SD.

