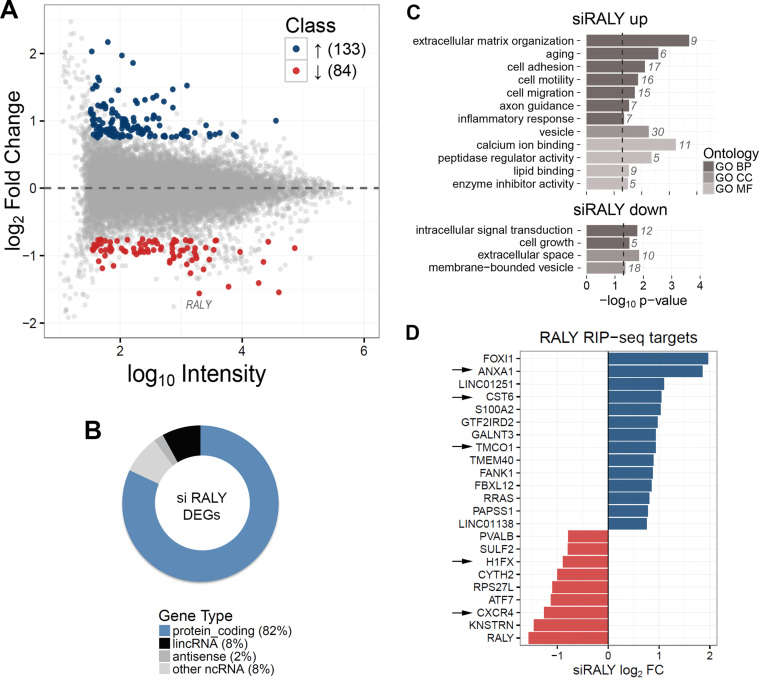
Figure 4.
Identification of up and downregulated genes upon RALY silencing in MCF7 cells. Four independent microarray experiments were performed using RNA preparations in four independent biological replicates. (A) MA plot of transcriptome profiling in RALY silenced MCF7. For each gene, the average log10 signal against the RALY silencing log2 Fold Change (siRALY versus control) is plotted. Genes significantly up- (blue) or down- (red) regulated upon RALY silencing are highlighted. (B) Classification of differentially expressed genes (DEGs) upon RALY silencing according to RNA classes. The majority (82%) of transcripts is protein-coding genes. LincRNAs (8%) and antisense RNAs (2%) are also present. (C) Functional annotation enrichment analysis of RALY upregulated and downregulated genes. The barplot displays enriched classes from Gene Ontology terms (BP, biological process; CC, cellular component; MF, molecular function). (D) Intersection of the list of RALY RIP-seq targets and the list of siRALY differentially expressed genes. Blue and red bars represent up and down DEGs, respectively. The arrows indicate the experimentally validated genes.

