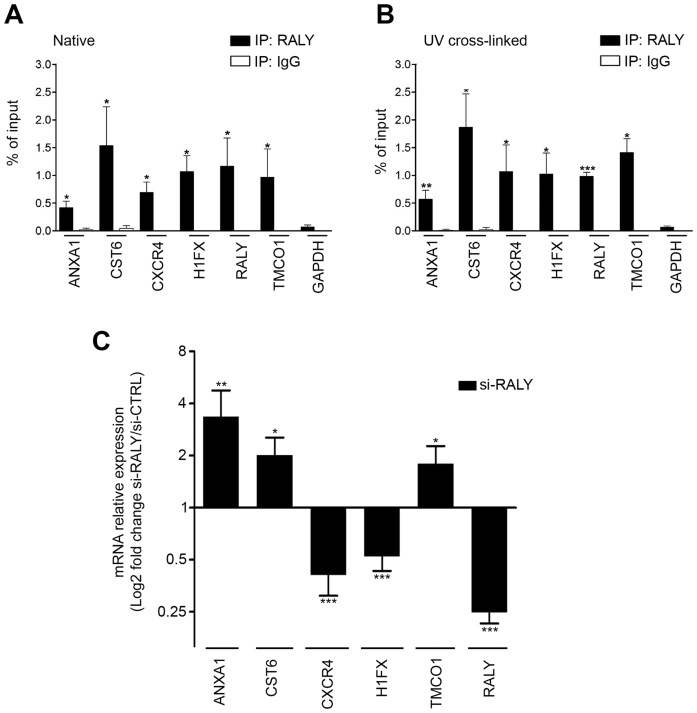
Figure 5.
Validation of the identified RALY-associated mRNAs (A) qRT-PCR was used to compare the indicated mRNAs isolated upon RALY immunoprecipitation with RNA recovered after immunoprecipitation with IgG. All the relative abundances were compared to 10% of input. The experiments were performed at least three times. Bars represent means ± S.E.M. P-value was calculated comparing the amount of each sample with the amount of GAPDH using an unpaired two tailed t-test (*P < 0.05; **P < 0.01; ***P < 0.001). (B) qRT-PCR was used to compare the indicated mRNAs isolated upon UV-crosslinked RALY immunoprecipitation with RNA recovered after immunoprecipitation with IgG. The experiments were performed at least three times. Bars represent means ± S.E.M. P-value was calculated comparing the amount of each sample with the amount of GAPDH using an unpaired two tailed t-test (*P < 0.05; **P < 0.01; ***P < 0.001). (C) qRT-PCR was performed to assess the levels of the indicated transcripts after silencing of RALY in MCF7 cells. Results are presented in terms of change after normalizing to GAPDH mRNA. Each value represents the mean of at least three independent experiments ± S.E.M. P-value was calculated using an unpaired two-tailed t-test (*P < 0.05; **P < 0.01; ***P < 0.001).

