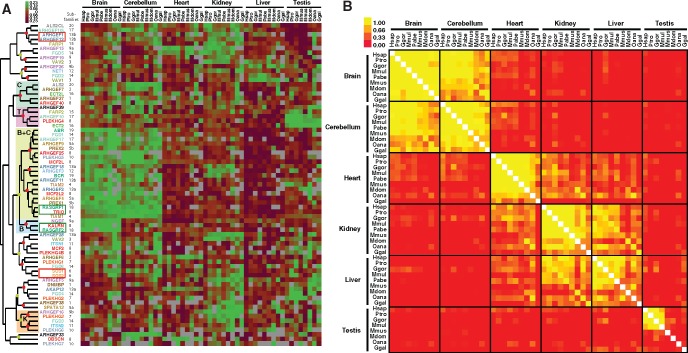
Fig. 4.
—Conservation of tissue specific expression of Dbl-like RhoGEFs in vertebrates. (A) Heatmap of RhoGEF mRNA expression in six tissues across nine vertebrate species. Orthologous RhoGEF values were extracted from global RNA-seq data. Mean centered log10(RPKM) values were normalized and hierarchically clustered (Euclidian distance, complete method). Colors of RhoGEF names and sub-families correspond to those delineated in figure 1A. Red and green frames illustrate closely related members expressed in same or distinct tissues, respectively. Red and green dots indicate clusters with Pearson correlations of > 0.7 and >0.5, respectively. B: Brain; C: Cerebellum; K: Kidney. Hsap: Homo sapiens; Ptro: Pan troglodytes; Ggor: Gorilla gorilla; Mmul: Macaca mulatta; Pabe: Pongo abelii; Mmus: Mus musculus; Mdom: Monodelphis domesticus; Oana: Ornithorhynchus anatinus; Ggal: Gallus gallus. (B) Symmetrical heat map of Pearson correlations from RhoGEF gene mRNA expression (log RPKM values) for the six tissues and nine species examined.

