. 2017 Jun 29;6:e23532. doi: 10.7554/eLife.23532

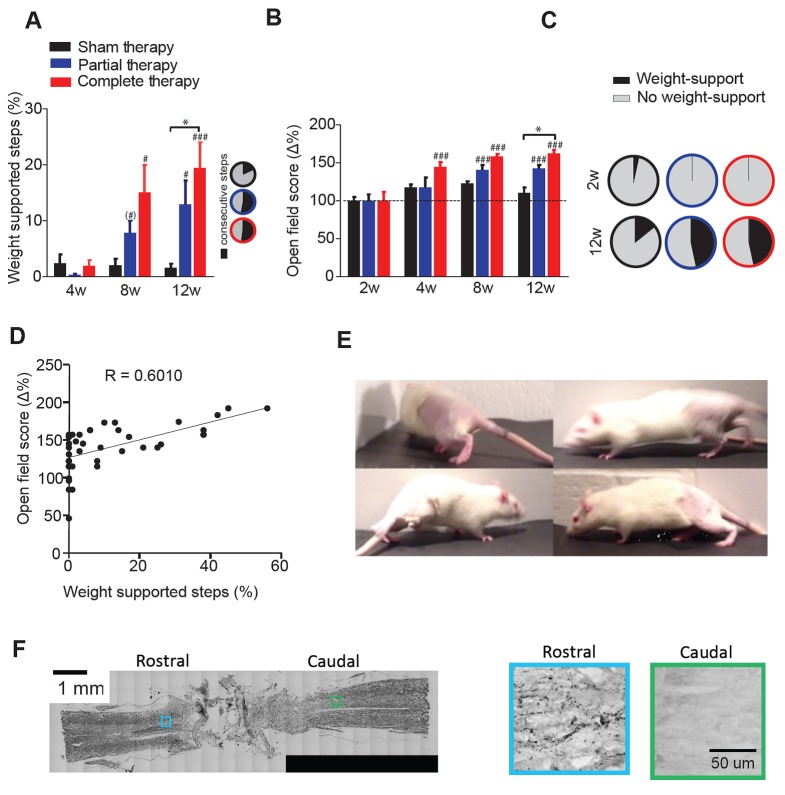
Figure 1. Locomotor recovery after a complete spinal cord injury.

(A) Percentage of weight supported step cycles (% WSS) during treadmill locomotion for complete therapy (red), partial therapy (blue) and sham therapy (black) groups at 4, 8 and 12 weeks post-injury. Pie charts indicating the fraction of these weight supported steps that were part of a consecutive bout of three or more step cycles for each group (right panel inset, black: percentage of consecutive steps, grey: nonconsecutive steps). (B) Open field score measured by the BBB scale, expressed as % change from baseline at 2 weeks post injury. (C) Pie charts showing the proportion of BBB scores that correspond to weight support in the hindlimbs during unassisted open field locomotion (≥9) at 2 weeks (top panel) and 12 weeks (bottom panel). (D) Correlation between the open field score and %WSS at 12 weeks after injury. (E) Example frames of a spinalized rat after 12 weeks of complete therapy taking plantar weight supported steps with its hindlimbs in the open field. (F) Histological verification of complete spinal transection using Nissl stain (left) of a horizontal section of the spinal cord. 5-HT stain (right) of a rostral and caudal location taken from a slice adjacent to the Nissl stained slice on the left. Boxes represent the approximate location of the higher magnification picture of 5-HT stain. # represents differences from week 2 or 4 and * represents differences within the same week. (*) p<0.1, *p<0.05, **p<0.01, ***p<0.001. Error bars indicate 95% confidence intervals.

DOI: http://dx.doi.org/10.7554/eLife.23532.002

Figure 1.

Figure 1—figure supplement 1. Assisted weight support provided during training.
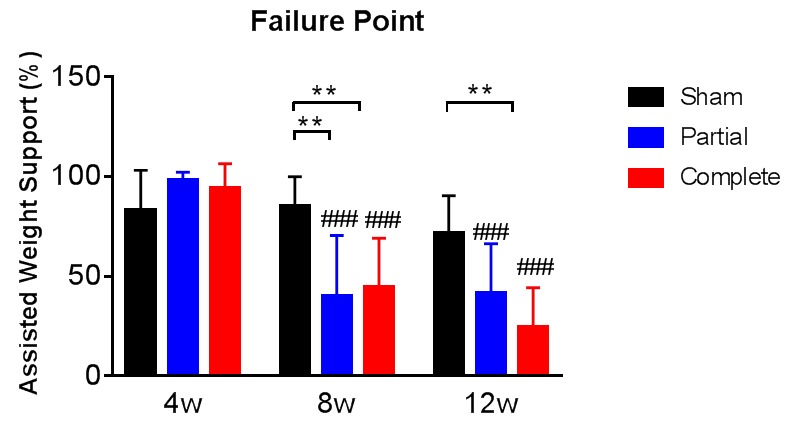
Figure 1—figure supplement 1.

At the start of each week of treadmill training the amount of the animal’s body weight that was supported by the device was adjusted to optimize stepping abilities. The animals failed to step below a certain level of body weight support and this was defined as their failure point for that week. The failure point was evaluated also in animals that received sham therapy or partial therapy. The graph tracks the failure point at 4, 8 and 12 weeks after the spinal cord transection for all three groups, expressed as % of the assisted weight support provided by the device when the animals could not bear any weight with their hindlimbs at 2 weeks after the spinal cord transection (y-axis). # represents differences from week four and * represents differences within the same week *p<0.05, **p<0.01, ***p<0.001, Tukey post-hoc tests after significant time x therapy interaction of 2-way mixed ANOVA (F(4,72)=4.2, p=0.0009). Note that we obtained failure point data for 12 sham-therapy, 12 partial-therapy and 15 complete-therapy animals. Error bars indicate 95% confidence intervals. The assisted weight support at failure point decreased with partial and complete therapy as a function of time after the spinal transection, providing direct evidence of increasing levels of weight support achieved by the animals.
Figure 1—figure supplement 2. A schematic representation of the body weight support device that was used during treadmill training.
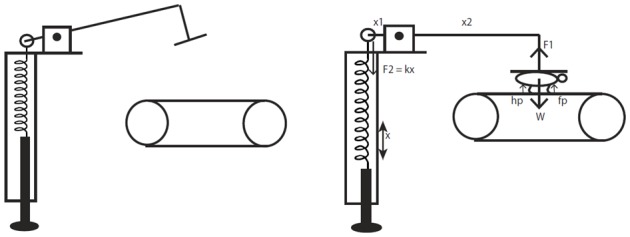
Figure 1—figure supplement 2.

The device is a spring-mass system adapted for quadrupedal locomotion from Timoszyk et al. (2005), which introduced a similar device for bipedal locomotion. The forces acting on the device are briefly illustrated in the diagram for visualization. When the horizontal arm is parallel to the ground the moments acting around the pivot point are balanced. The device is calibrated a priori and periodically using weights to determine the amount of spring extension required for providing a fixed amount of vertical weight support corresponding to a percentage of the animal’s weight. Note that during locomotion when the forelimbs and hindlimbs are loaded and pushing on the treadmill there will be normal reaction forces acting on the animal (indicated as fp and hp on the figure) and the exact amount cannot be measured without additional sensors.