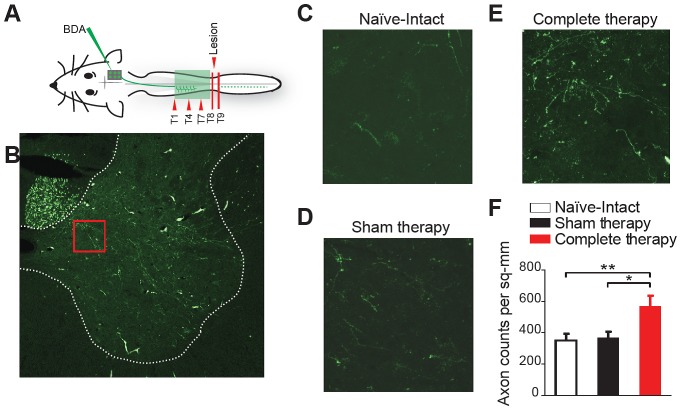
Figure 4. Corticospinal sprouting into the thoracic spinal cord.
(A) Diagram illustrating anterograde tracing experiments. (B) Histology of a sample coronal slice of the thoracic spinal hemi-cord taken from above the level of the spinal lesion and a magnified view of the sprouting into the grey matter in (C) Naïve-Intact (D) Sham therapy and (E) Complete therapy groups. (F) Bar graphs showing the average count of corticospinal axons sprouting per mm2 of gray matter of the spinal hemi-cord for the different groups. *p<0.05, **p<0.01. Error bars indicate 95% confidence intervals.

