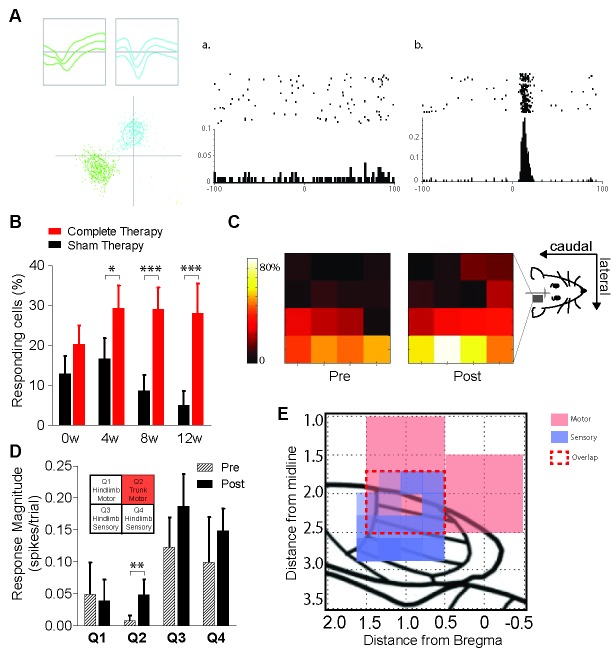
Figure 5. Reorganization of the hindlimb sensory cortex induced by combined therapeutic interventions.
(A) Example showing single unit discrimination using waveform-based cluster analysis (left panel) and exemplar peri-stimulus time rasters and histograms of (a) a neuron which is unresponsive to sensory stimulation and (b) a neuron showing a significant response to sensory stimulation measured in a window extending 100 ms before and after the stimulus. (B) Proportion of neurons recorded from sham therapy group (black) that had a significant response to forepaw sensory stimulation compared to that of complete therapy group (red) pre- transection (0w) and weeks 4 (4w), 8 (8w) and 12 (12w) post-transection. (C) Heat maps indicating distribution of forepaw sensory responses recorded on each of the wires of the 4 × 4 microwire electrode array implanted into the hindlimb sensorimotor cortex pre- (week 0) and post- (weeks 4, 8, 12) spinal transection. (D) Average magnitude of the neural responses to forepaw stimulation broken down into four quadrants based on the location of the electrode wire (top left inset: quadrant locations), pre- and post- spinal transection. (E) Depiction of the rat sensorimotor cortex after complete spinal transection followed by 12 weeks of combined therapies. X-axis is the rostrocaudal distance from bregma, y-axis is the mediolateral distance from bregma. Red represents expansion of motor cortex, purple represents expansion of forelimb somatosensory cortex into the deafferented hindlimb cortex. Red dashed lines represent the extent of sensorimotor overlap within the confines of our recorded regions. *p<0.05, **p<0.01, ***p<0.001. Error bars indicate 95% confidence intervals.
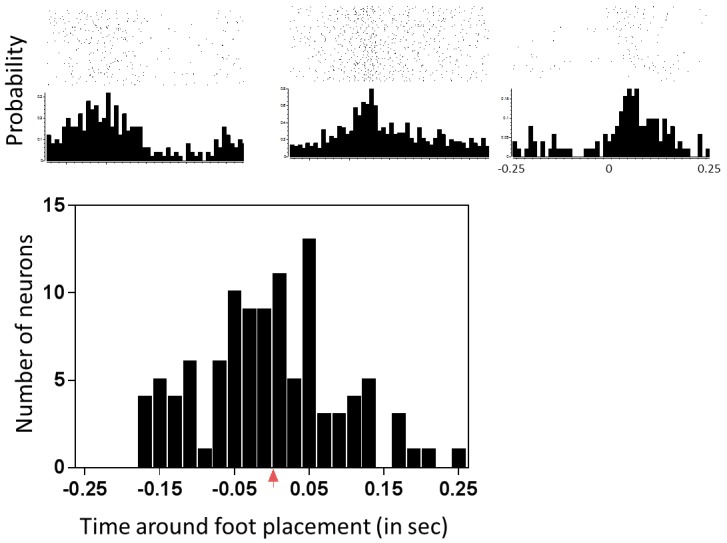
Figure 5—figure supplement 1. Characterization of neuronal responses to forepaw placement on the treadmill during locomotion.


