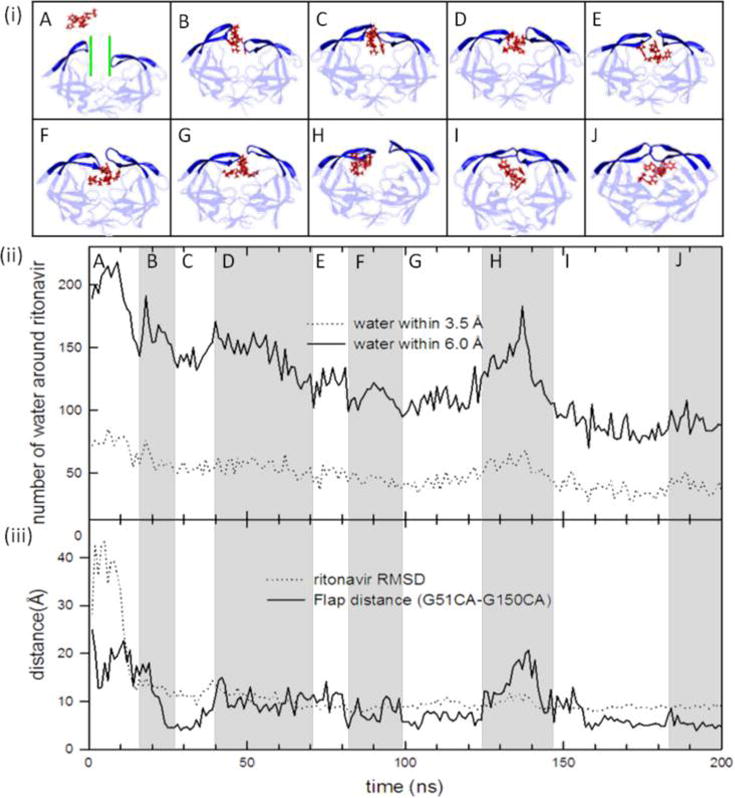
Figure 7.

Ritonavir experiences multiple transitions during the association. (i) MD snapshots show ritonavir binding to HIVp with open flaps. Each snapshot represents a major conformation in the simulation time zone from A to J. The channel through which the ligand needs to pass is colored green. (ii) Number of water molecules around ritonavir within its first (3.5 Å) and second (6.0 Å) hydration shells. Gray and white highlight the change in the number of water molecules in different simulation time zones. (iii) Ritonavir RMSD and flap distance during the MD simulation.
