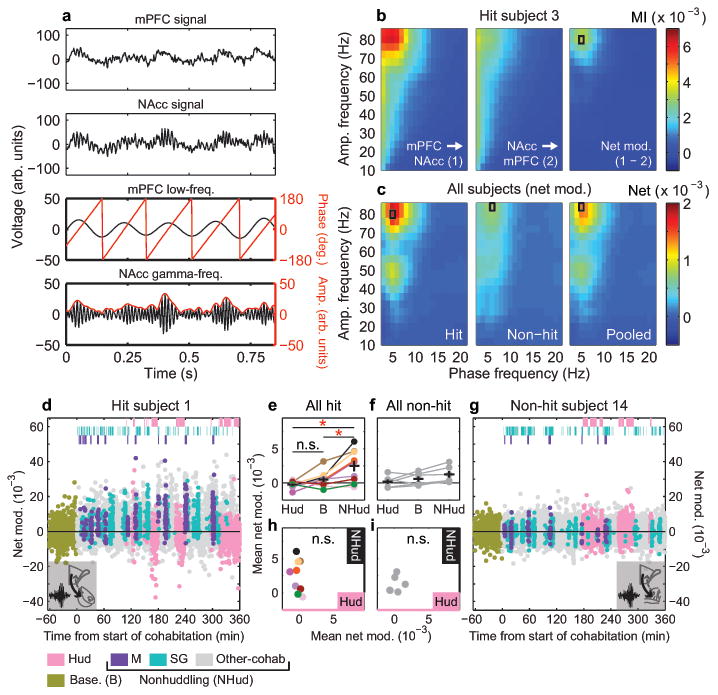
Figure 2. mPFC-NAcc cross-frequency coupling is dynamically modulated and behavior-dependent.

a, Example raw LFP from mPFC (top) and NAcc (upper middle), filtered into low-frequency (lower middle) and gamma-frequency (bottom) bands, shows gamma amplitude modulation by low-frequency phase. b, Modulation Index (MI) of phase-amplitude coupling for example hit subject showing mPFC-to-NAcc (left) and NAcc-to-mPFC (middle) directions during cohabitation. “Net modulation” (right) is difference in MI between directions. c, Mean net modulation for hit (left, n = 9), non-hit (middle, n = 6), or pooled (right, n = 15) subjects shows peaks when mPFC low-frequency phase modulates NAcc (or non-hit) gamma amplitude (indicated by black rectangle). d, Net modulation values (2-s, non-overlapping windows) sampled over a baseline solo period (gold points) and 6-hr cohabitation for example hit and (g) non-hit subjects. Values that temporally overlap with mating, self-grooming and huddling behaviors (top hashes) are color-coded accordingly. All non-scored values are indicated as “other-cohab,” which together with mating and self-grooming represent “nonhuddling” values. e, Mean net modulation across subjects during huddling, baseline and nonhuddling behaviors in all hits and (f) non-hits. Net modulation varies with behavior in hits (F1.219, 9.754 = 9.44, P = 0.010, Greenhouse-Geisser corrected; post-hoc, NHud vs. B, t8 = 3.39, P = 0.028; NHud vs. Hud, t8 = 3.17, P = 0.040; Hud vs. B, t8 = 1.81, P = 0.322) but not non-hits (F1.027, 5.133 = 3.94, P = 0.102, Greenhouse-Geisser corrected). h, Nonhuddling and huddling net modulations are not correlated in either hits (R2 = 0.10, P = 0.417) or (i) non-hits (R2 = 0.06, P = 0.630). Reported P-values in e, f are Bonferroni-corrected for multiple comparisons (see Methods). Error bars show mean ± s.e.m.
